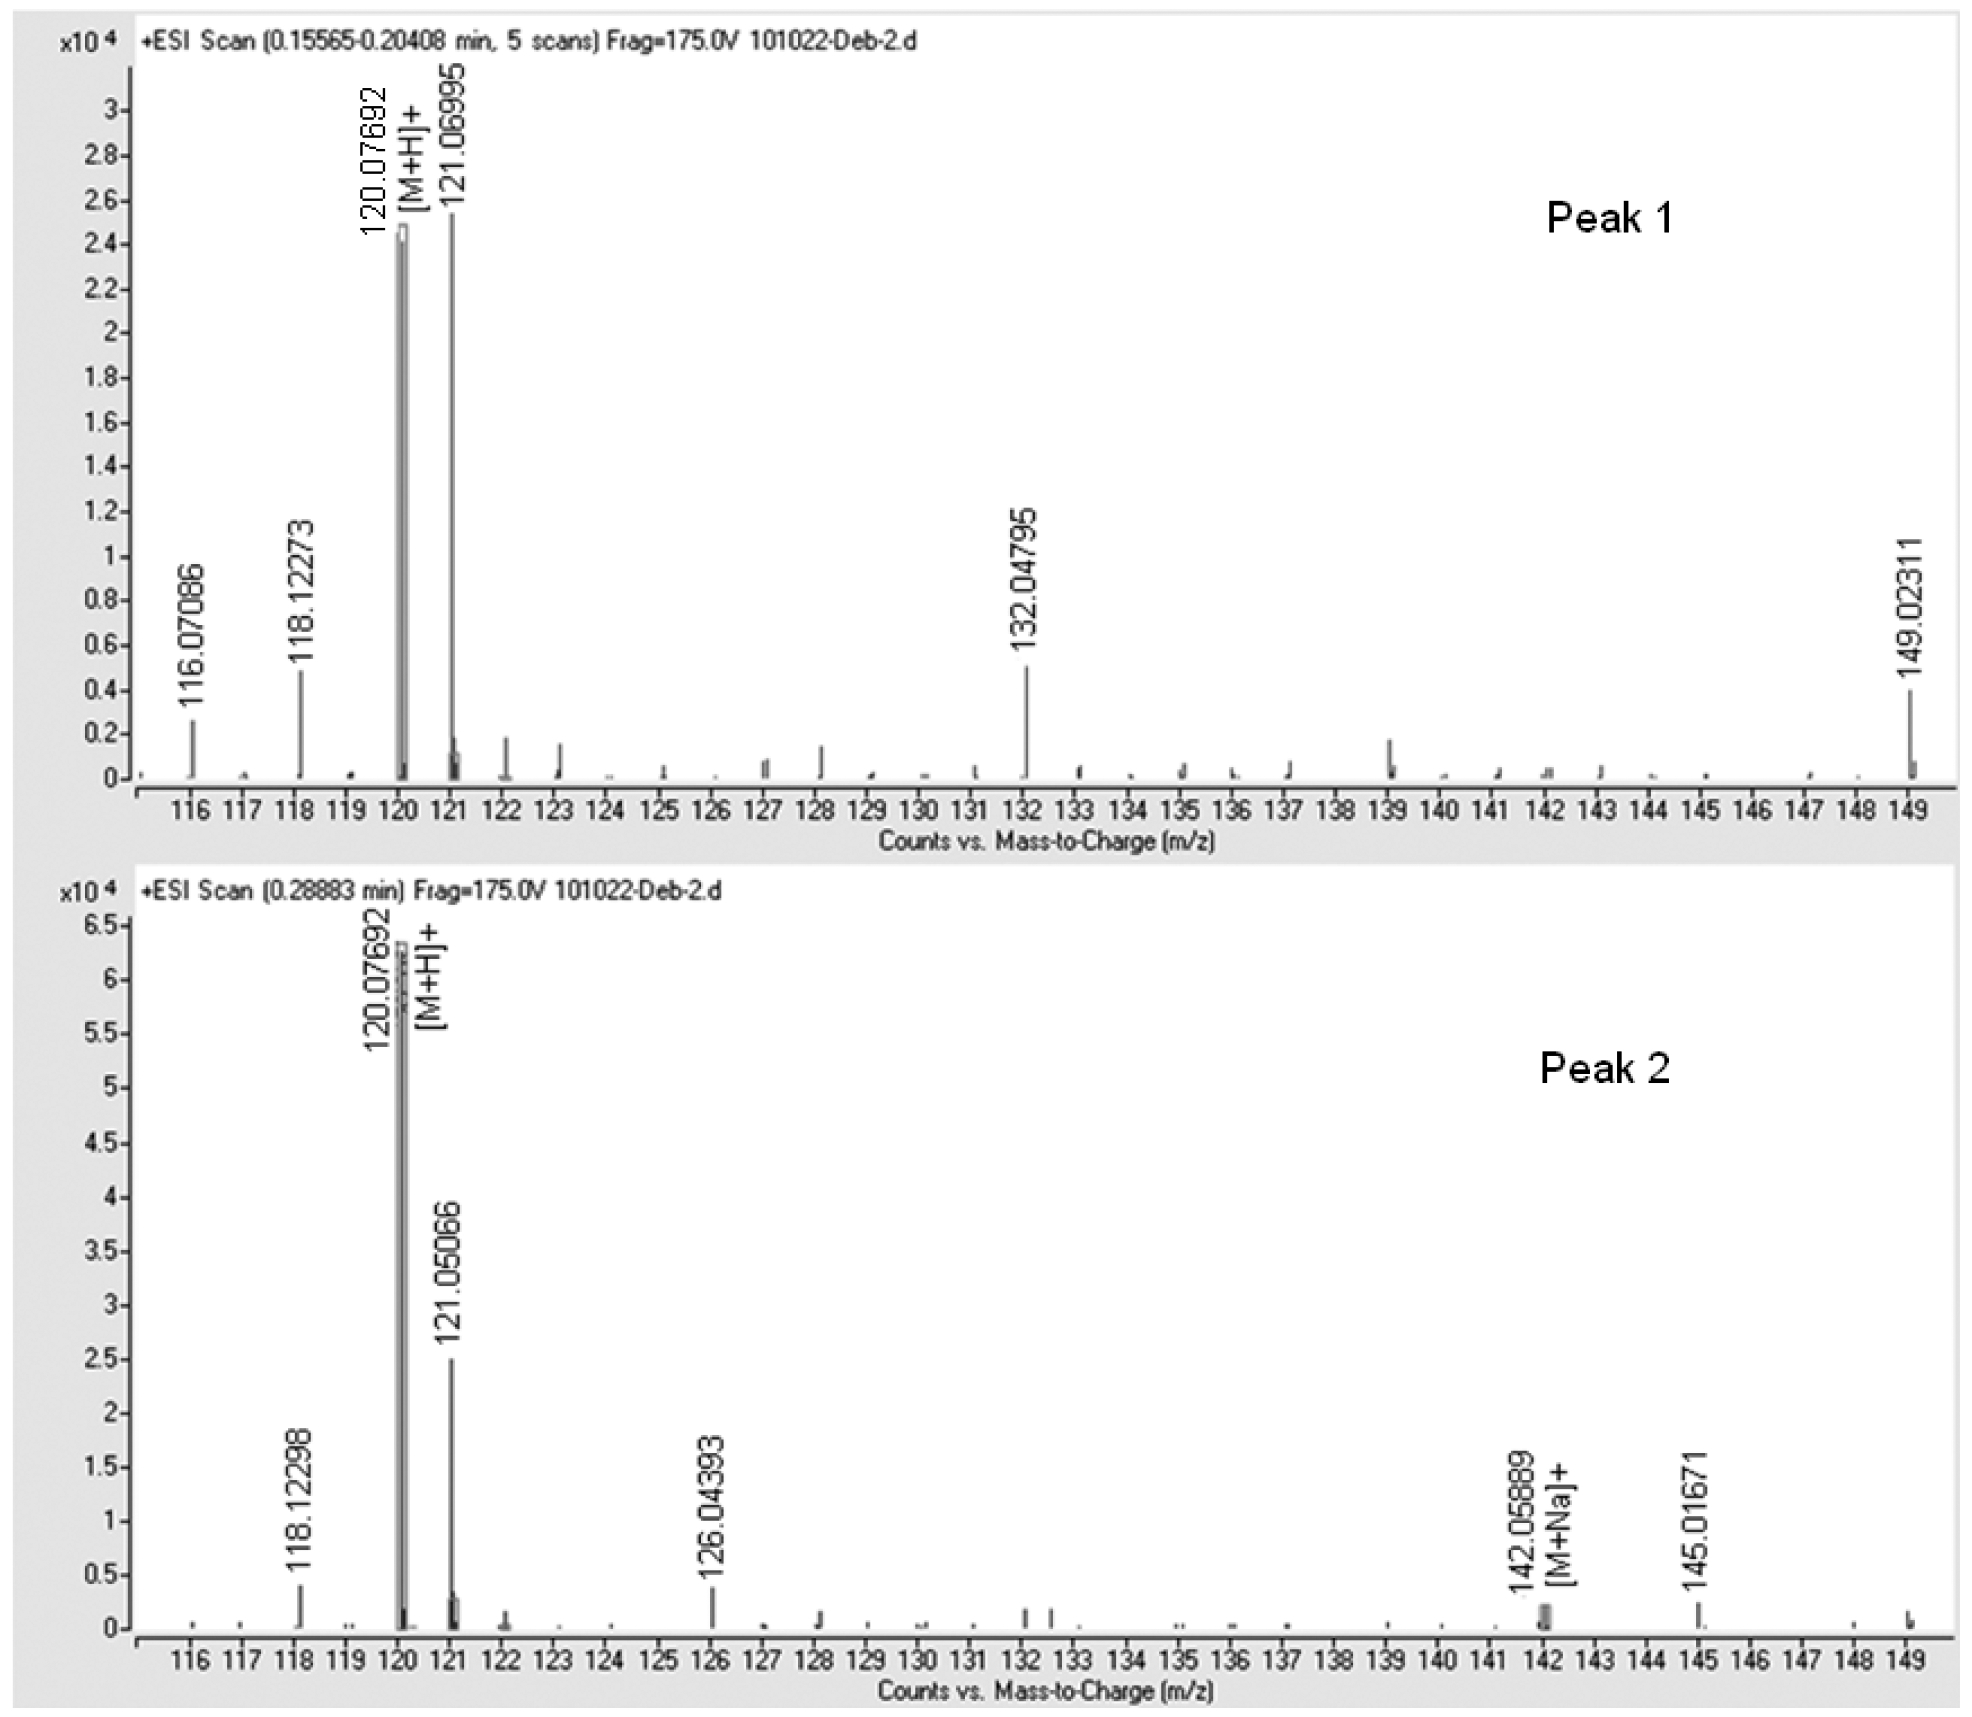
Figure 3.

High resolution mass spectra for the two peaks of compound 13 in the extracted ion chromatogram presented in the supporting information. Peak 1 has an [M+H]+ = 120.07682. Peak 2 has an [M+H]+ = 120.07692 and an [M+Na]+ = 142.05889. Note, the ion with an m/z = 121.051 is due to purine, which was added as an internal reference ion to obtain high resolution spectra of our analytes. All other ions are attributable to background interference.
