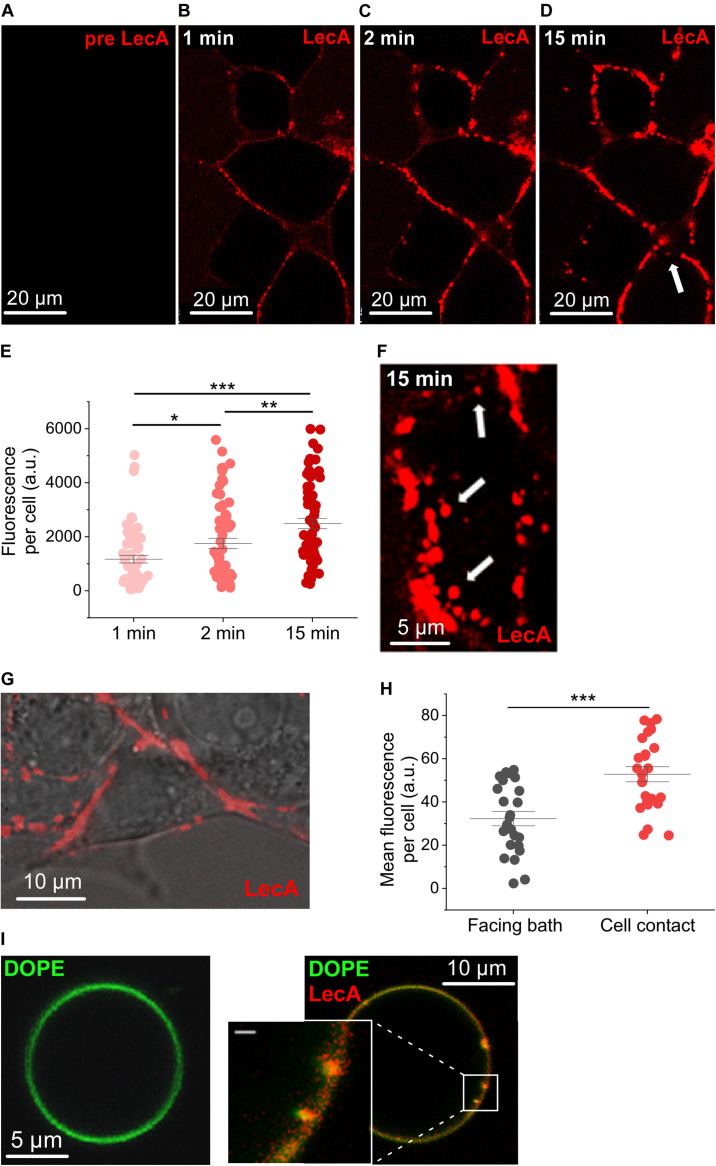
FIGURE 1.
LecA binding to HEK cells and giant unilamellar vesicles. Representative confocal microscopy images (one plane) of HEK cells incubated with LecA (in red). (A) Before application of 500 nM LecA. (B) LecA within the first minute after application. (C) LecA accumulation at 2 min. (D,F) appearance of first endosomes at 15 min (arrows). (E) Quantification of the fluorescence of LecA per cell at 1, 2, and 15 min (n = 63; N = 6). Significance was assessed by the t-test. (G) Overlay of transmission light and fluorescence microscopy, illustrating LecA accumulation at cell-cell contact site and less LecA staining at the cell membrane facing the bath. (H) Quantification of the mean fluorescence of LecA per cell at membranes facing the bath or facing a neighboring cell (cell contact; n = 24; N = 6). Significance was assessed by the t-test. (I) Gb3-decorated giant unilamellar vesicle (Atto 647N 1,2-dioleoyl-sn-glycero-3-phosphoethanolamine (DOPE), green) without (left) and with (right) 500 nM of LecA (red). LecA (500 nM) binds to Gb3 and induces tubular membrane invaginations (inset, scale bar = 1 μm). *p ≤ 0.05, **p < 0.01, and ***p < 0.001.

