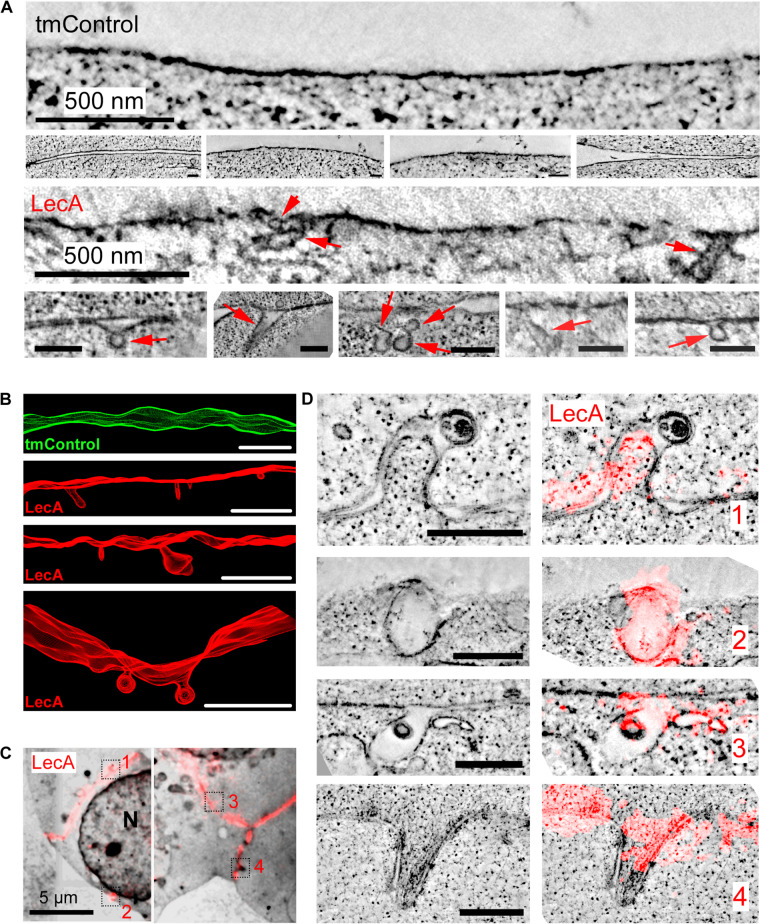
FIGURE 2.
LecA-associated changes in membrane ultrastructure in HEK cells. (A) Representative 2D electron tomographic slices (maximum projection over 50 nm) of tmControl cells (top rows) and cells exposed for 17 min to 500 nM LecA (bottom rows), demonstrating the morphology of LecA-associated surface membrane invaginations. If not otherwise stated, scale bars = 200 nm. (B) Representative 3D electron tomographic reconstructions of surface plasma membrane in tmControl (top, green) and LecA-exposed cells (red), demonstrating numerous membrane invaginations. Reconstructed volume: (4,190 × 4,190 × 300) nm3; scale bars = 500 nm. (C) CLEM overview maps of LecA-exposed cells, demonstrating the preferential localization of the fluorescent signal at the cell-cell interfaces. The median free gap width between adjacent cells in areas of high fluorescence signal is 8.8 nm. Squares highlight the location of larger resolution images in (D). N, nucleus. (D) Representative 2D electron tomographic slices (left) and corresponding CLEM images (right) of LecA-exposed cells. The slices demonstrate the colocalization of LecA staining (red) with plasma membrane invaginations on neighboring and single (second panel from above) cells. Scale bar = 500 nm.

