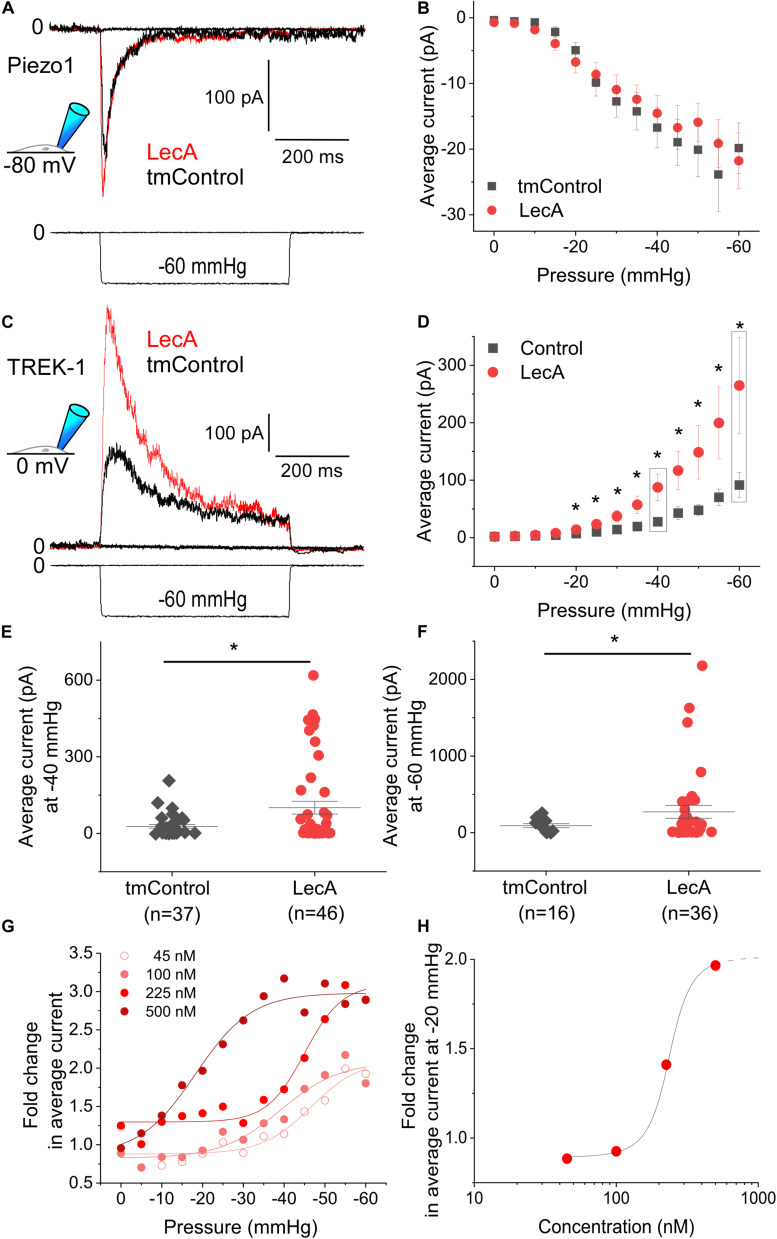
FIGURE 3.
Mechanically-induced Piezo1 and TREK-1 activity in absence or presence of LecA in HEK cells. Patch-clamp measurements in cell-attached configuration showing Piezo1 (A,B) and TREK-1 (C–H) activity, at holding potentials of −80 and 0 mV, respectively, after 2 min of exposure to 500 nM LecA (red), compared to time-matched controls (tmControl, black). (A) Representative Piezo1 recording during application of negative pressure (mechanical activation) of −35 mmHg. (B) Quantification of Piezo1 activity in the absence or presence of LecA at 0 mmHg (n = 38 and 38, respectively) and −60 mmHg (n = 23 and 23, respectively, lower n-numbers in tmControl cells are caused by patches that did not withstand −60 mmHg suction levels). Significance assessed by the t-test. (C) Representative TREK-1 recording during application of negative pressure (mechanical activation) of −60 mmHg. (D) Quantification of TREK-1 activity in the absence and presence of LecA at 0 mmHg (n = 43 and 46, respectively) and −60 mmHg (n = 16 and 36, respectively; lower n-numbers in tmControl as above). Significance assessed by the t-test. (E,F) Single data points and means ± SEM of TREK-1 at −40 and −60 mmHg. Significance was assessed by the t-test. (G) Fold change (LecA/tmControl) in TREK-1 average current at suction levels from 0 to −60 mmHg for different LecA concentrations (45, 100, 225, and 500 nM). The averaged data were fitted with a Boltzmann function. (H) Concentration-response curve, the stretch-induced fold change (LecA/tmControl) in TREK-1 average current at −20 mmHg is presented as a function of LecA concentration. *p ≤ 0.05.

