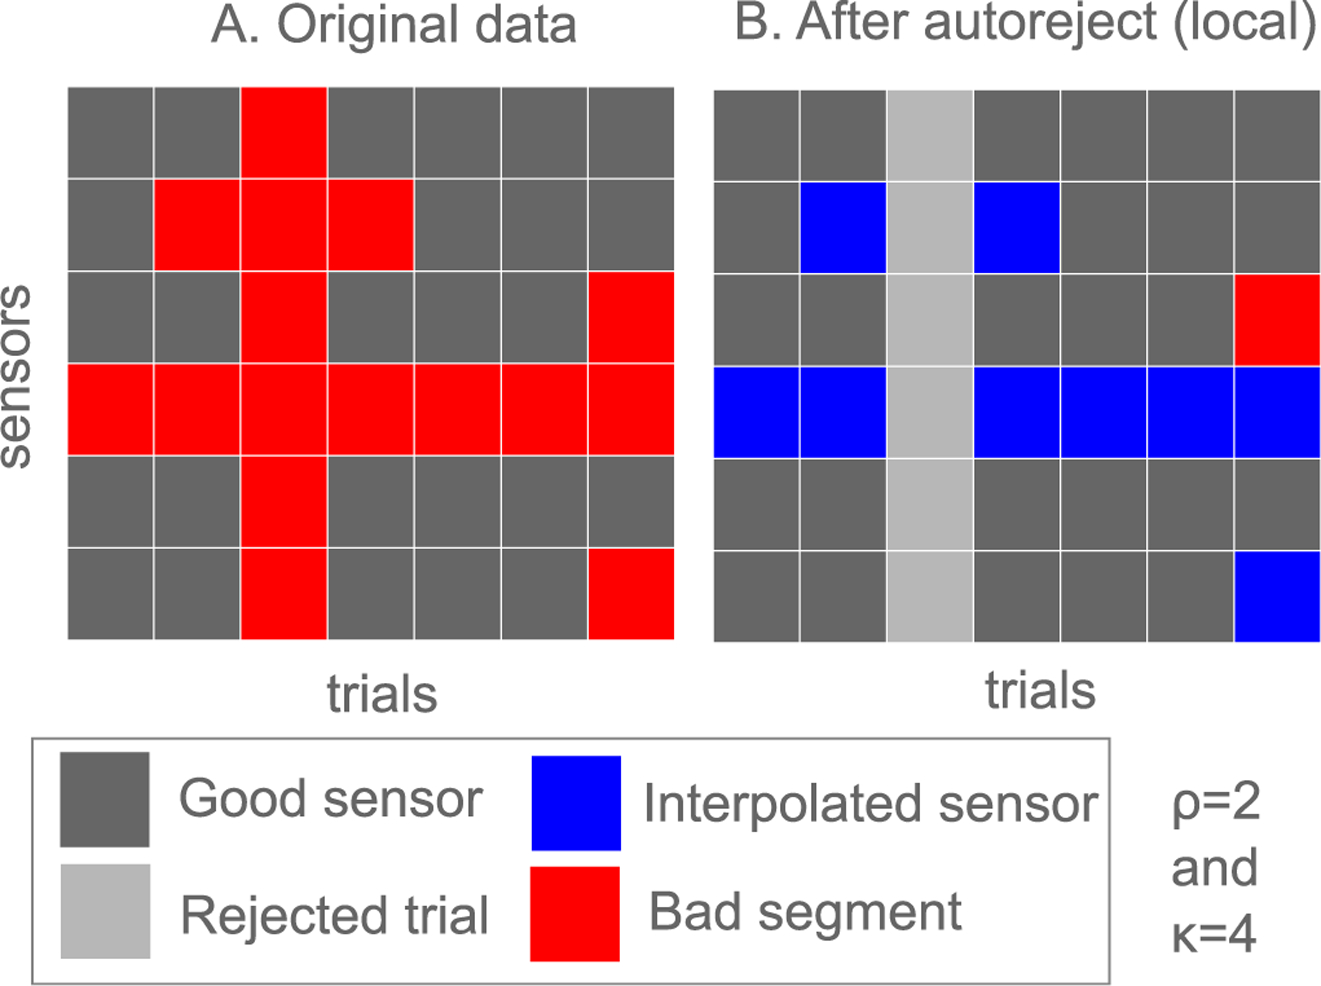
Fig. 2.

A schematic diagram explaining how autoreject (local) works. (A) Each cell here is an element of the indicator matrix Cij described in the section on Autoreject (local). Sensor-level thresholds are found and bad segments are marked for each sensor. Bad segments shown in red are where Cij =1 (B) Trials are rejected if the number of bad sensors is greater than κ and otherwise, the worst ρ sensors are interpolated.
