
Fig. 4.
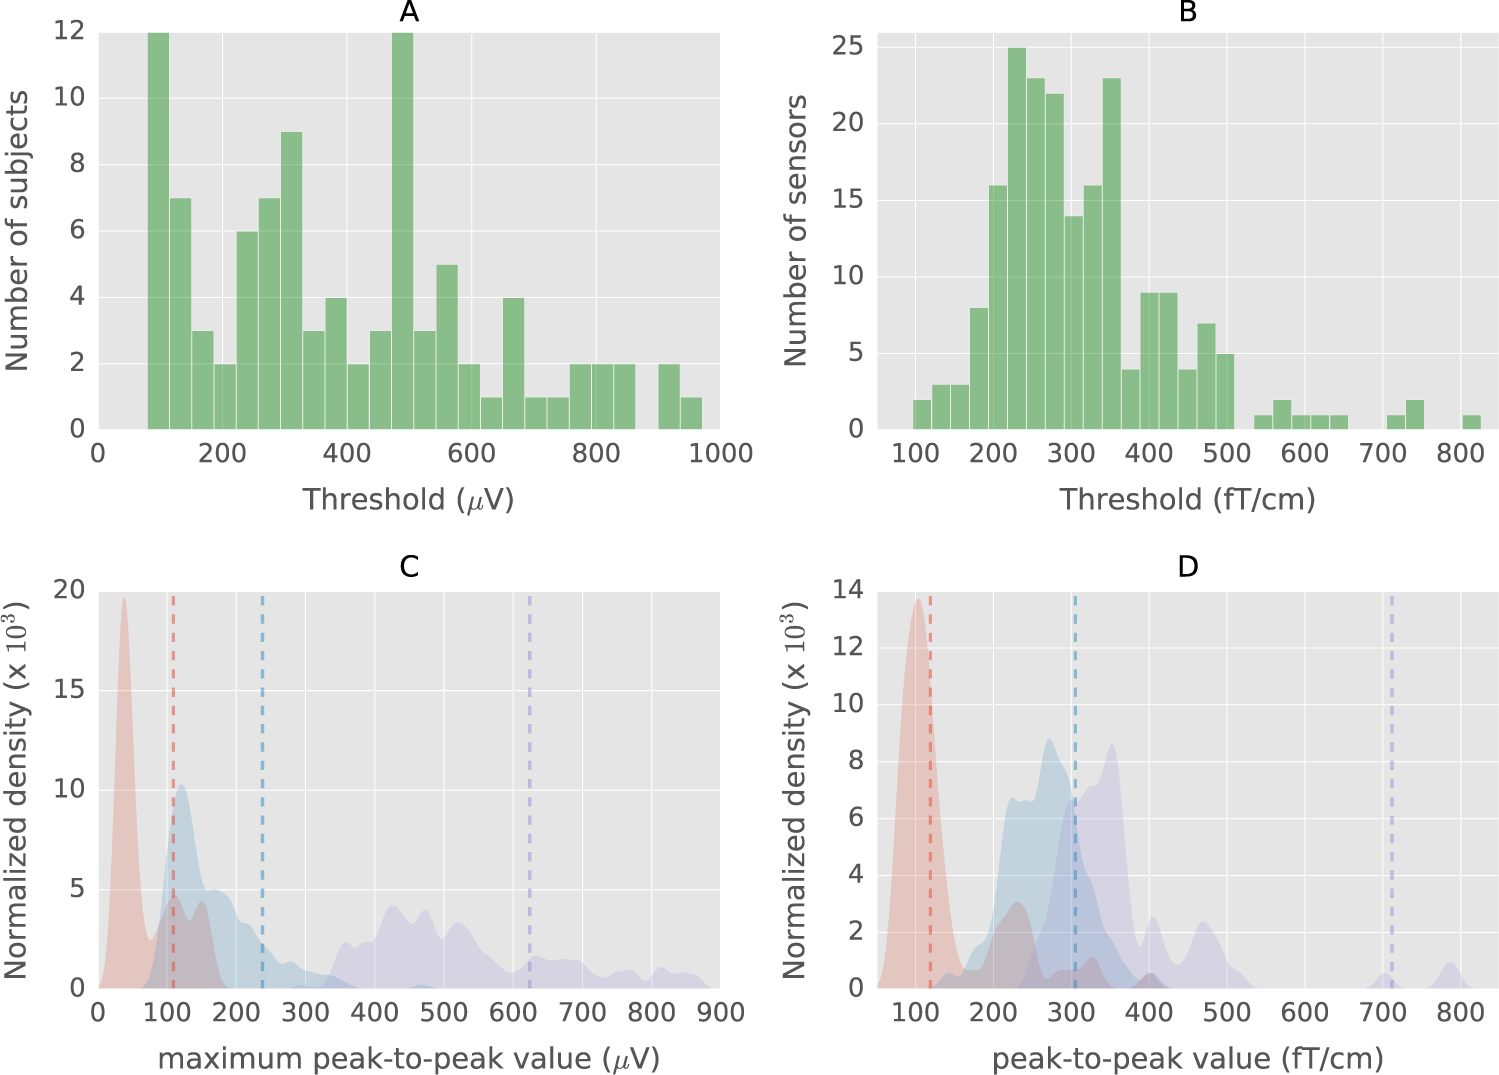
A. Histogram of thresholds for subjects in the EEGBCI dataset with autoreject (global) B. Histogram of sensor-specific thresholds in gradiometers for the MNE sample dataset (see Results). C. Normalized kernel density plots of maximum peak-to-peak value across sensors for three subjects in the EEGBCI data. Vertical dashed lines indicate estimated thresholds. Density plots and thresholds corresponding to the same subject are the same color. D. Normalized Kernel Density plots of peak-to-peak values for three MEG sensors in the MNE sample dataset. The threshold indeed has to be different depending on the data (subject and sensor).