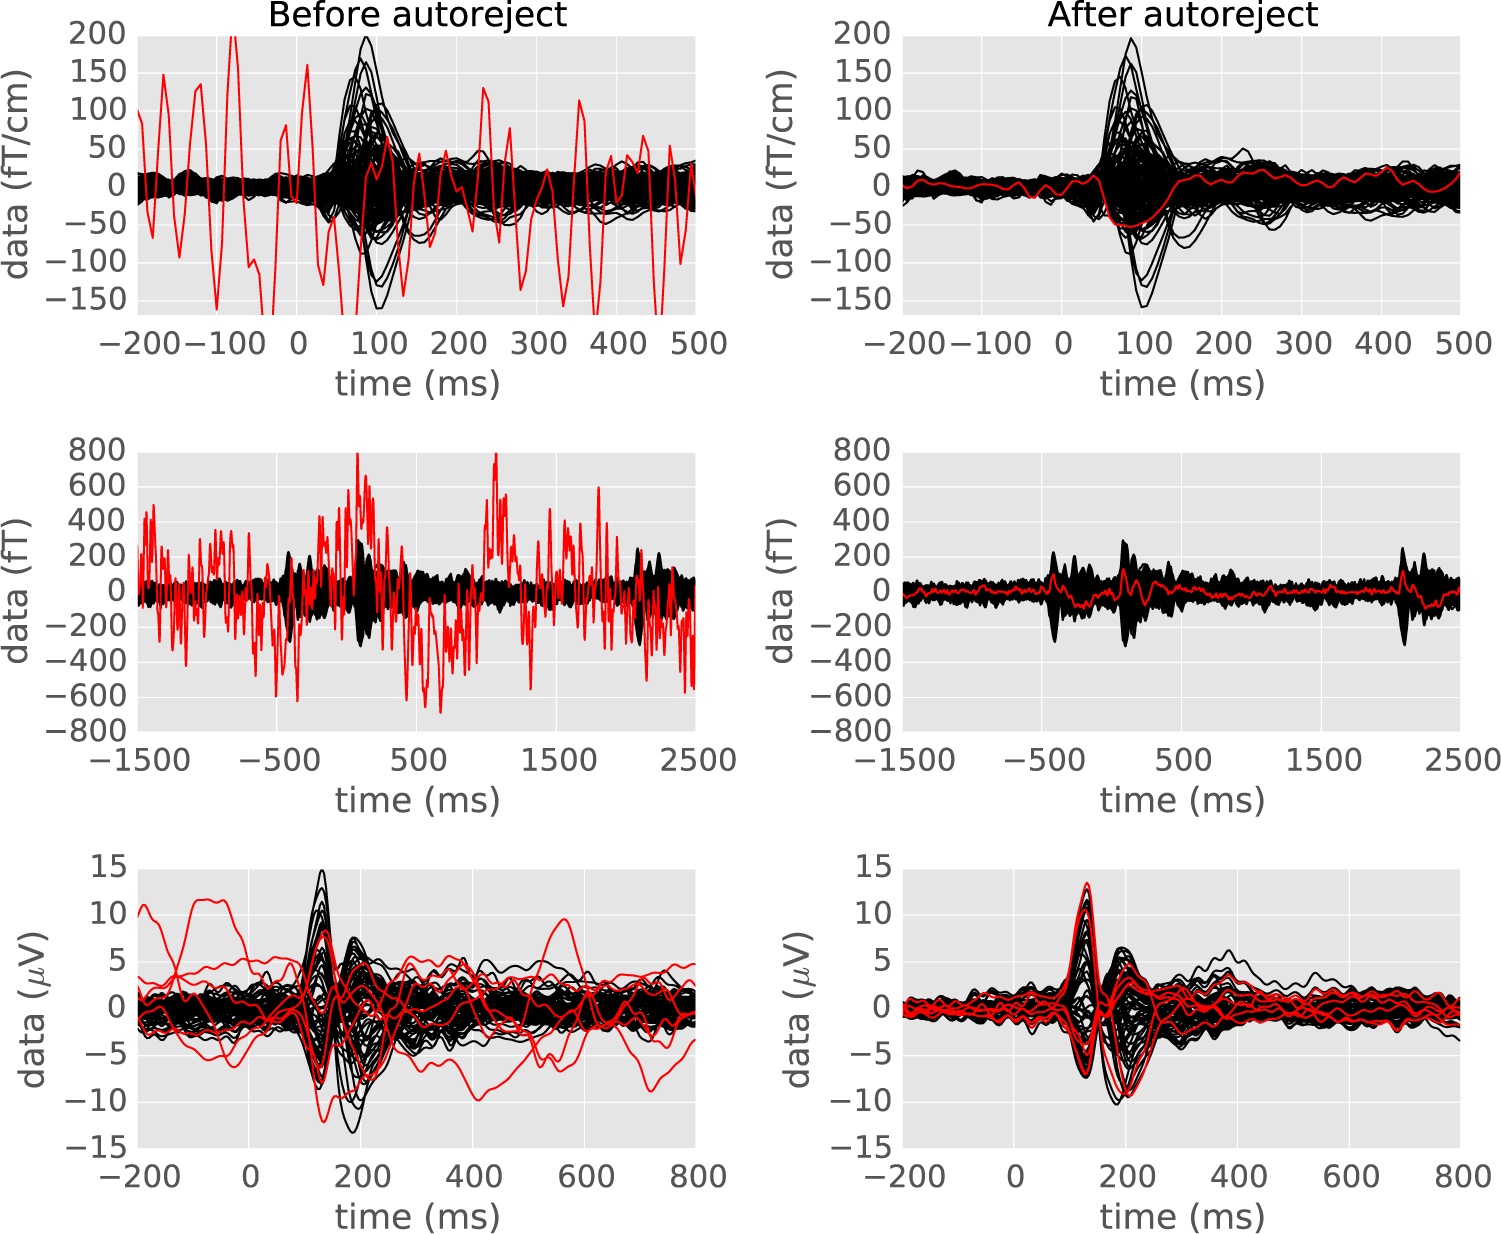
Fig. 5.

The evoked response (average of data across trials) on three different datasets before and after applying autoreject — the MNE sample data, the HCP data and the EEG faces data. Each sensor is a line on the plots. On the left, manually annotated bad sensors are shown in red. The algorithm finds the bad sensors automatically and repairs them for the relevant trials. Note that it can even fix multiple sensors at a time and works for different modalities of data acquisition.
