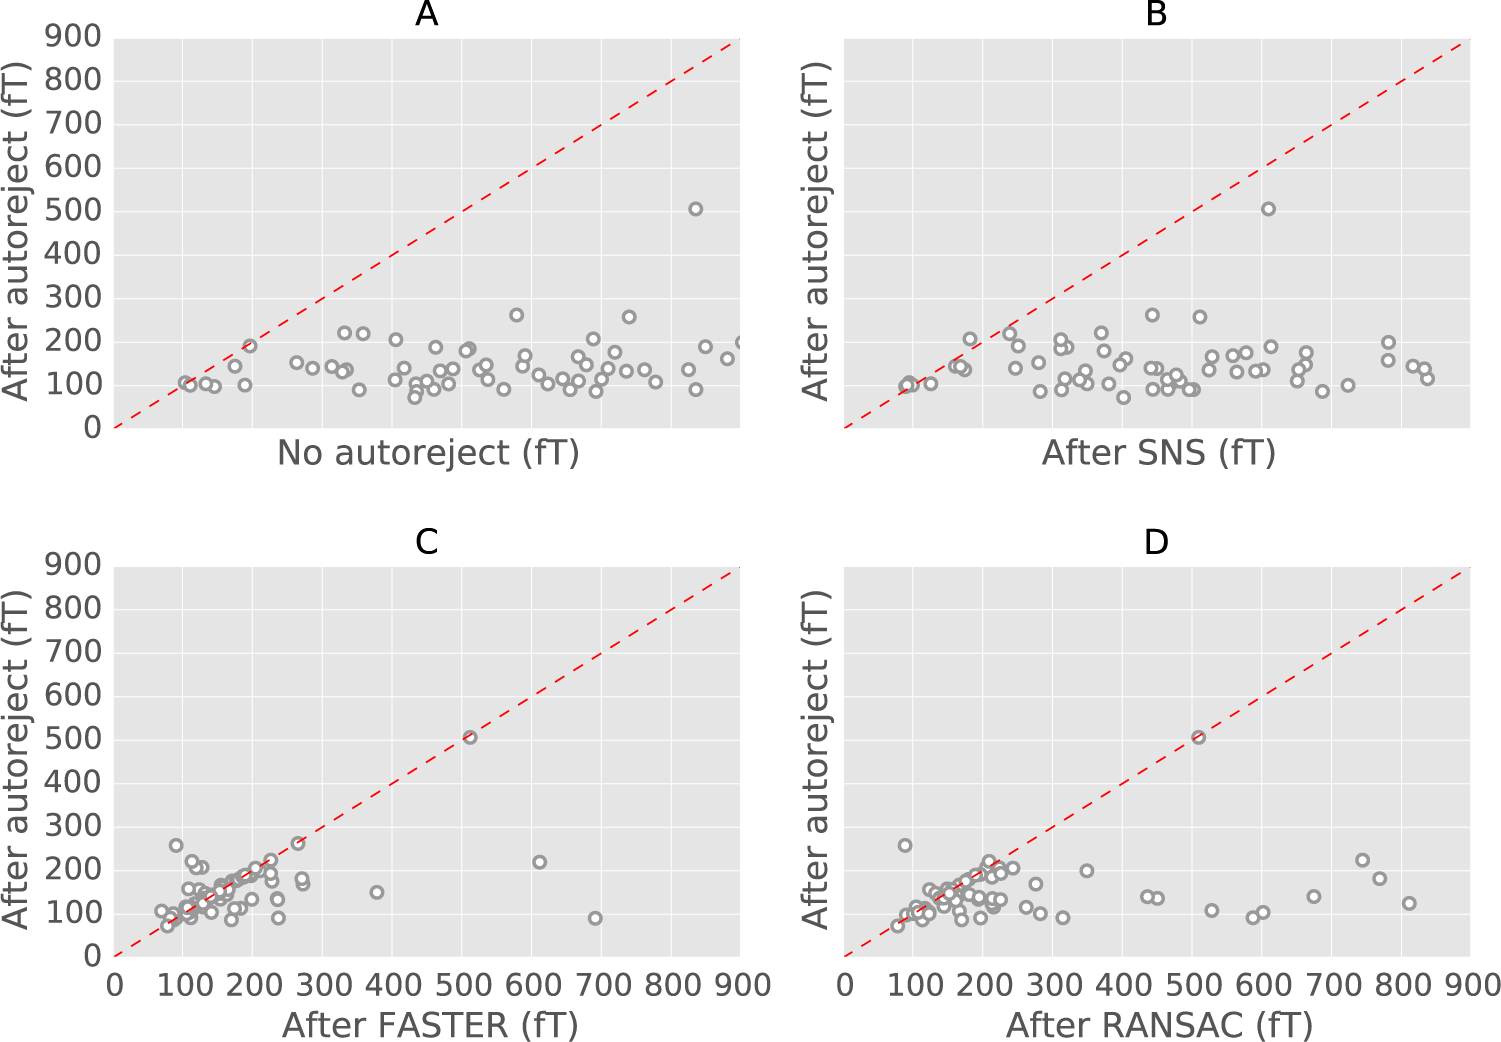
Fig. 6.

Scatter plots for the results with the HCP data. For each method, the ‖·‖∞ norm of the difference between the HCP ground truth and the method is taken. Each circle is a subject. (A) autoreject (local) against no rejection, (B) autoreject (local) against Sensor Noise Suppression (SNS) (SNS), (C) autoreject against FASTER, (D) autoreject (local) against RANSAC. Data points below the dotted red line indicate subjects for which autoreject (local) outperforms the alternative method.
