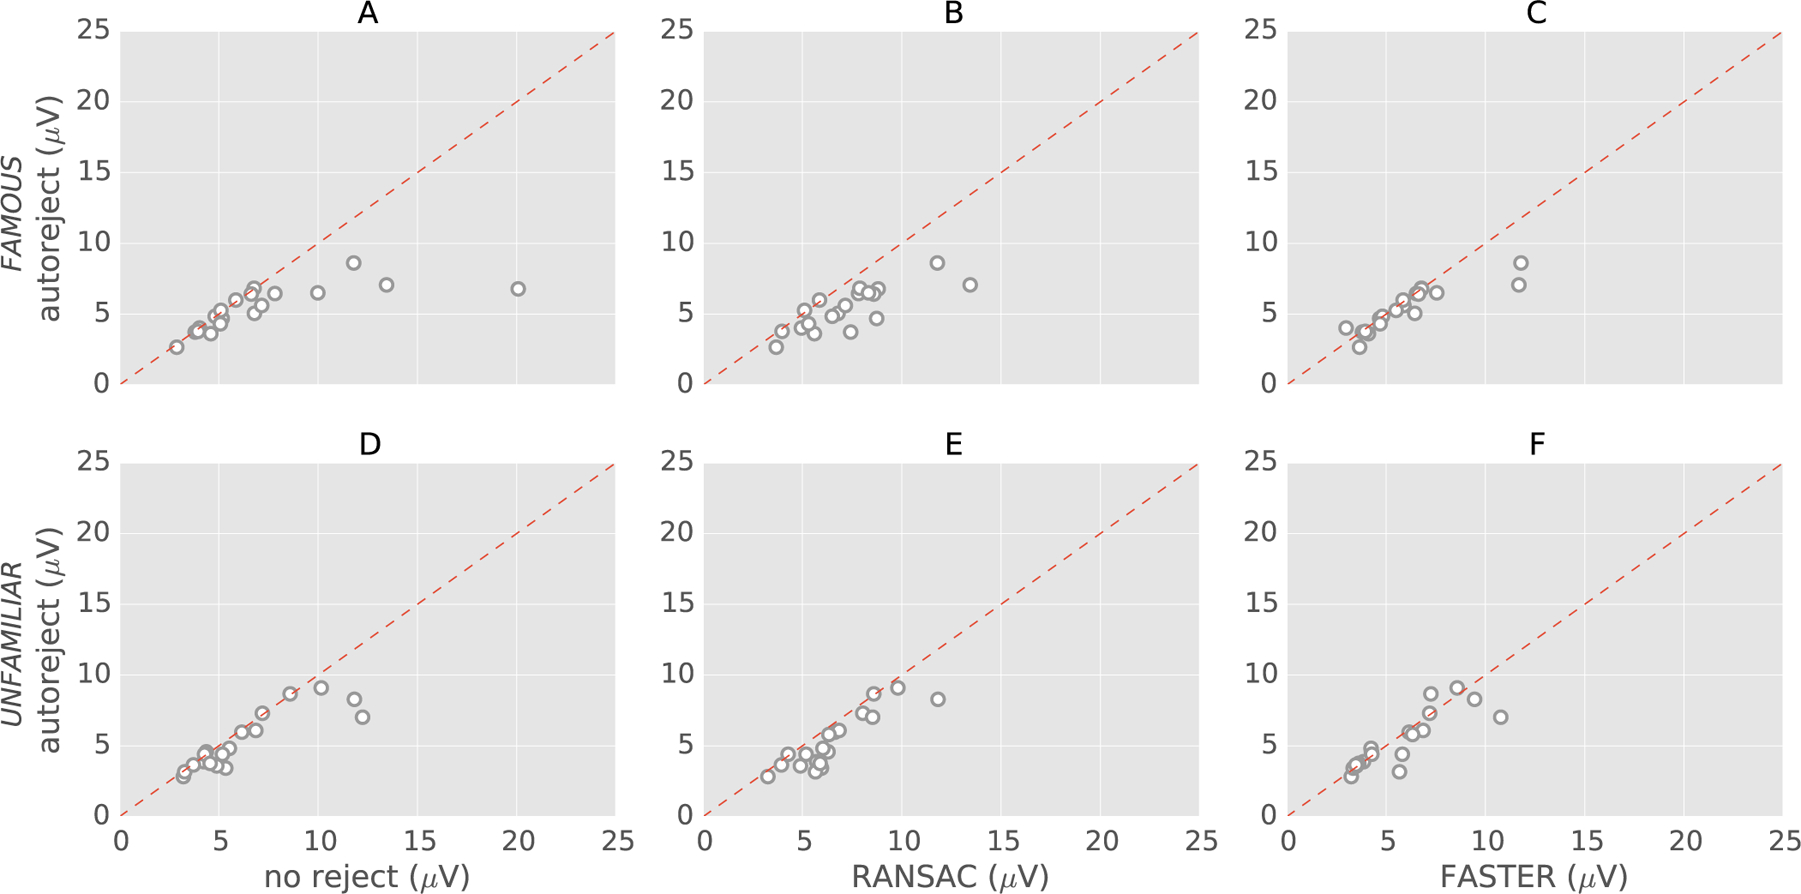
Fig. 7.

Scatter plots for the results with the 19 subjects from Faces dataset. The plots in the first row: (A), (B) and (C) are for the condition “famous”, whereas the plots in the second row: (D), (E) and (F) are for the condition “unfamiliar” faces. For each method, the ‖·‖∞ norm of the difference between the ground truth and the estimates is computed. Each circle is a subject. Data points below the dotted red line indicate subjects for which autoreject (local) outperforms the alternative method.
