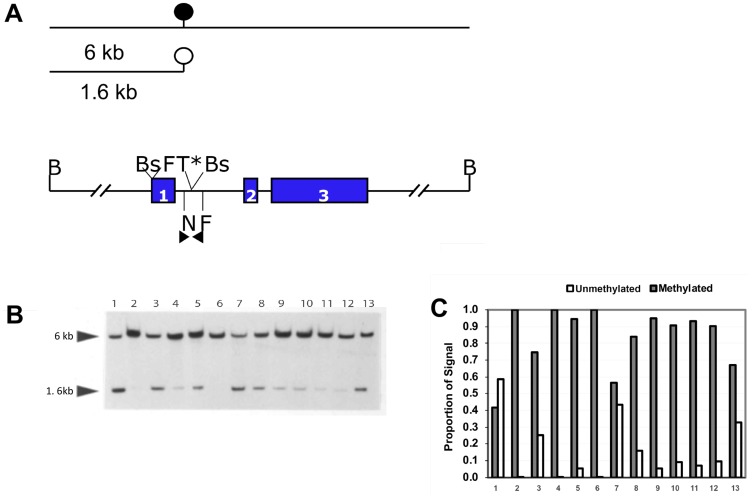
Figure 1. Quantitative methylation analysis shows that the NNAT CpG island is hypermethylated in human osteosarcoma tumor samples.
(A) Schematic and restriction map of NNAT. B, BamHI; F, FspI; T, Taqα1 (*indicates that the site is created by bisulfite modification); N, NruI; Bs, BssHII. Colored rectangles indicate exons. The solid circle indicates a methylated NruI site; the open circle indicates an unmethylated NruI site. Arrowheads indicate the positions and directions of primers for COBRA analysis and bisulfite-mediated PCR. Lines above the restriction map indicate the relative size of restriction fragments produced by digestion of genomic DNA with BamHI and NruI, depending on the methylation status of the NruI site. (B) Southern Blot autoradiographic analysis to quantitate NNAT CpG island methylation in human osteosarcoma cell lines and primary tumor samples. Genomic DNA samples were digested with restriction enzymes BamHI and NruI. Following agarose gel electrophoresis and transfer, the membrane was hybridized with a probe generated from the 1.6 kb NNAT upstream BamHI/NruI restriction fragment. DNA samples are: lane 1, cell line HOS; lane 2, cell line MNNG/HOS; lanes 3–13, human osteosarcoma tumor samples. (C) Densitometric quantitation of NNAT CpG island methylation in human osteosarcoma tumor samples. Bars represent the proportion of total autoradiographic signal representing methylated and unmethylated alleles for each DNA sample.

