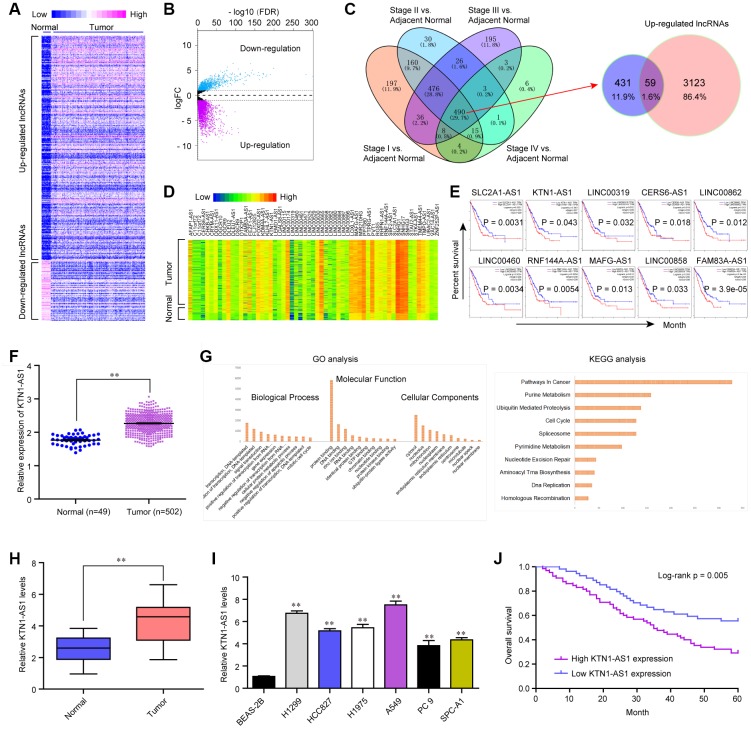
Figure 1.
KTN1-AS1 was up-regulated in NSCLC. (A) Heatmap of differentially express (DE) lncRNAs using TCGA data analysis. (B) Volcano plots show differentially expressed lncRNAs based on the TCGA datasets. (C) Venn diagram of altered lncRNAs in TCGA datasets and the data from Cancer RNA-seq Nexus program. (D) The heatmap of the 59 lncRNAs expression which was analyzed above based on the TCGA datasets. (E) Overall survivals of several lncRNAs for NSCLC patients were analyzed by “GEPIA”. (F) Relative expression of KTN1-AS1 using TCGA data analysis. (G) GO and KEGG analysis for the preliminary exploration of KTN1-AS1 function. (H) qPCR analyzed the expression of KTN1-AS1 in our cohort. (I) Relative KTN1-AS1 levels in six NSCLC cells and BEAS-2B cells. (J) Kaplan-Meier survival analysis of NSCLC patients’ overall survival based on KTN1-AS1 expression in our cohort (n = 127). * P < 0.05, **P < 0.01.

