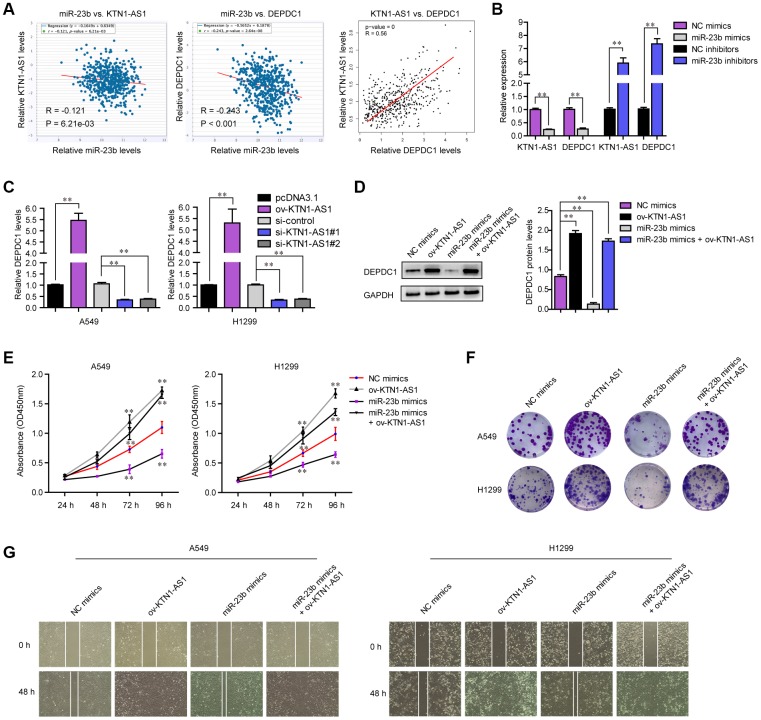
Figure 8.
KTN1-AS1 modulated DEPDC1 expression via miR-23b in NSCLC. (A) starBase program analyzed the expressing correlation between miR-23b and KTN1-AS1, and DEPDC1. The expressing correlation between KTN1-AS1 and DEPDC1 was also analyzed by GEPIA. (B) qPCR evaluated the relative expression of KTN1-AS1 and DEPDC1 in A549 cells after transfection with miR-23b mimics and inhibitors. (C) qPCR examined the relative expression of DEPDC1 in NSCLC cells after their KTN1-AS1 was overexpressed or silenced. (D) Western blot determined the protein levels of DEPDC1 in A549 cells after various treatment. (E) CCK-8 assays determined the cellular growth. (F) Cell colony formation assays. (G) Wound-healing assays. * P < 0.05, **P < 0.01.

