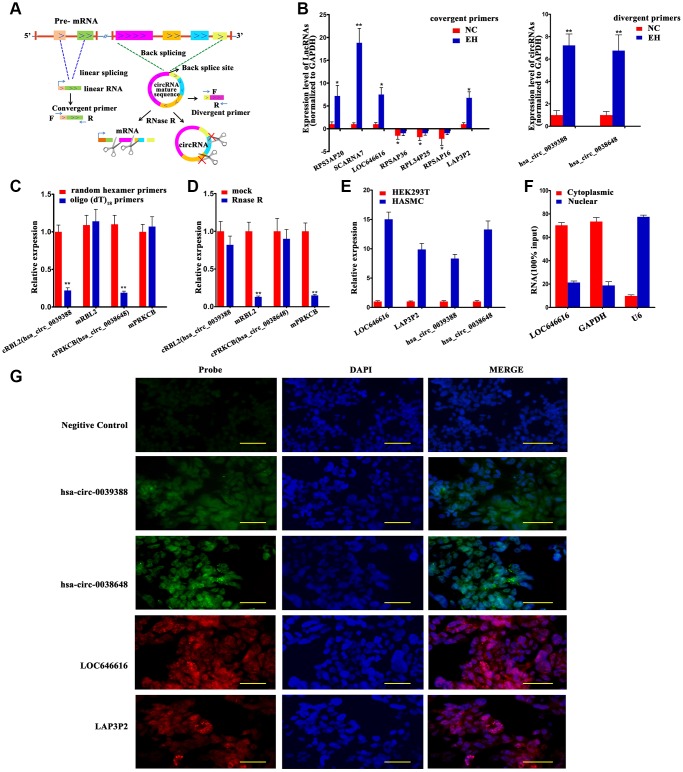
Figure 3.
Validation of DE lncRNAs and DE circNAs. (A) Schematic diagram of validation patterns for DE lncRNAs and circRNAs. All samples were sequenced in the same batch. The screening criteria were log2 FC>1 or <-1, FDR<0.05. (B) qRT-PCR expression analysis of 7 DE lncRNAs (left panel) and 2 DE circRNAs (right panel) in PBMNCs from 60 hypertensive subjects and 60 normotensive controls. (C) qRT-PCR analysis of relative RNA levels generated using random hexamer or oligo (dT)18 primers in reverse transcription experiments. Data are normalized to those generated using random hexamer primers. (D) qRT-PCR analysis of 2 DE circRNAs and their linear host transcripts after treatment with RNase R. (E) Expression of LOC646616, LAP3P2, hsa_circ_0039388, and hsa_circ_0038648 detected by qRT-PCR in HASMCs and HEK293T cells. (F) Cytoplasmic and nuclear expression of LOC646616 in HASMCs measured by qRT-PCR. GAPDH served as cytoplasmic control, whereas U6 served as nuclear control. (G) RNA fluorescence in situ hybridization (FISH) analysis indicating predominantly cytoplasmic distribution for LOC646616 and hsa_circ_0038648 in HASMCs (red fluorescence indicates LAP3P2 and LOC646616 expression; green fluorescence indicates hsa_circ_0038648 and hsa_circ_0039388 expression). Scale bar = 20 μm. Data are presented as the mean ± SD. n = 3 biologically independent samples. *P<0.05, **P<0.01.

