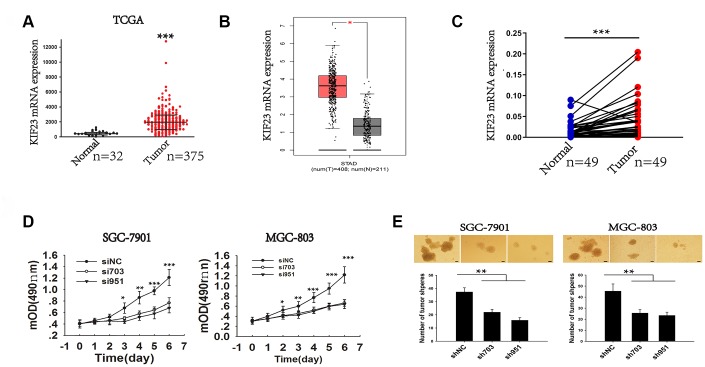
Figure 1.
Analysis of the elevated expression and role of KIF23 in GC. (A) TCGA dataset analysis of KIF23 gene expression in normal and tumor tissues. (B) The expression of KIF23 in gastric cancer was analyzed by using an online tool GEPIA. (C) Q-PCR analysis of KIF23 gene expression in 49 pairs of GC and matched tissues from our own hospital. (D) MTT cell viability assay was performed in SGC-7091 and MGC-803 cells with KIF23 knockdown at different days. (E) Deletion of KIF23 to observe its effect on tumor sphere formation capacity in SGC-7901 and MGC-803 cells. Representative photographs of the tumor spheres and the statistical analysis are shown. Data are the means ± SEMs of three independent experiments. * p < 0.05, ** p < 0.01, *** p < 0.001 vs. control.

