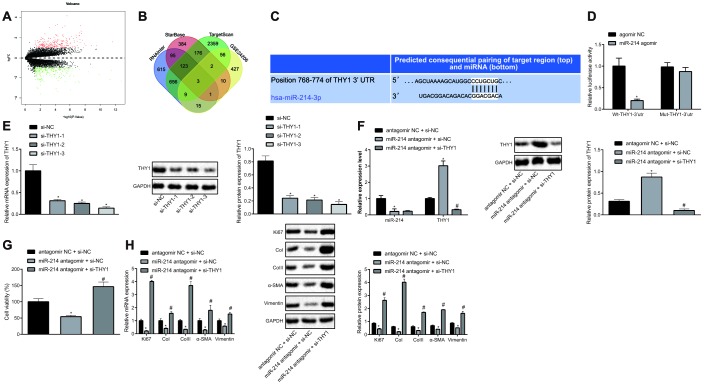
Figure 3.
Inhibition of miR-214 up-regulates THY1 to retard the proliferation and fibrogenic transformation of HEPFs. (A) Volcano map of the DEGs in the IPF obtained from microarray GSE24206, the abscissa represented the different log10 p value, the ordinate indicated logFC. Each dot in the map represented a gene, where red dots represent the up-regulated gene, and green dots represent the down-regulated gene in the IPF sample; (B) Venn diagram showing target genes of miR-214 predicted by TargetScan database, StarBase database and RNAInter database, respectively and DEGs in the IPF obtained from microarray GSE24206 and the intersection gene among those four sets; (C) The possible binding sites of miR-214 and THY1 predicted by TargetScan database; (D) The binding region between miR-214 and THY1 obtained from TargetScan database, and their relationship was verified by dual-luciferase reporter assay using recombinant Wt-THY1-3’UTR and Mut-THY1-3’UTR. *, p < 0.05 vs. cells transfected with agomir NC; (E) The THY1 mRNA and protein levels in HEPFs transfected with three si-THY1 sequences determined by RT-qPCR and western blot analysis, respectively. *, p < 0.05 vs. cells transfected with si-NC; (F) The expression of miR-214 and mRNA expression of THY1 measured by RT-qPCR, and the protein expression of THY1 assessed by western blot analysis in the HEPFs co-transfected with si-THY1/si-NC and miR-214 antagomir/antagomir-NC. *, p < 0.05 vs. cells co-transfected with si-NC and agomir NC, #, p < 0.05 vs. cells co-transfected with miR-214 antagomir and si-NC; (G) The viability of HEPFs co-transfected with si-THY1/si-NC and miR-214 antagomir/antagomir-NC evaluated by CCK8 experiment. *, p < 0.05 vs. cells co-transfected with antagomir NC and si-NC, #, p < 0.05 vs. cells co-transfected with miR-214 antagomir and si-NC; (H) The mRNA and protein levels of cell proliferation marker Ki67 and fibrosis biomarkers CoI, CoIII, α-SMA and vimentin in the HEPFs co-transfected with si-THY1/si-NC and miR-214 antagomir/antagomir-NC assessed by qRT-PCR and western blot analysis. *, p < 0.05 vs. cells co-transfected with antagomir NC and si-NC, #, p < 0.05 vs. cells co-transfected with miR-214 antagomir and si-NC. Statistical data were measurement data, and presented as mean ± standard deviation. Unpaired t-test was used for comparison between the two groups, and one-way ANOVA with Tukey's post hoc test was employed for comparisons among multiple groups. The experiment was independently repeated three times.

