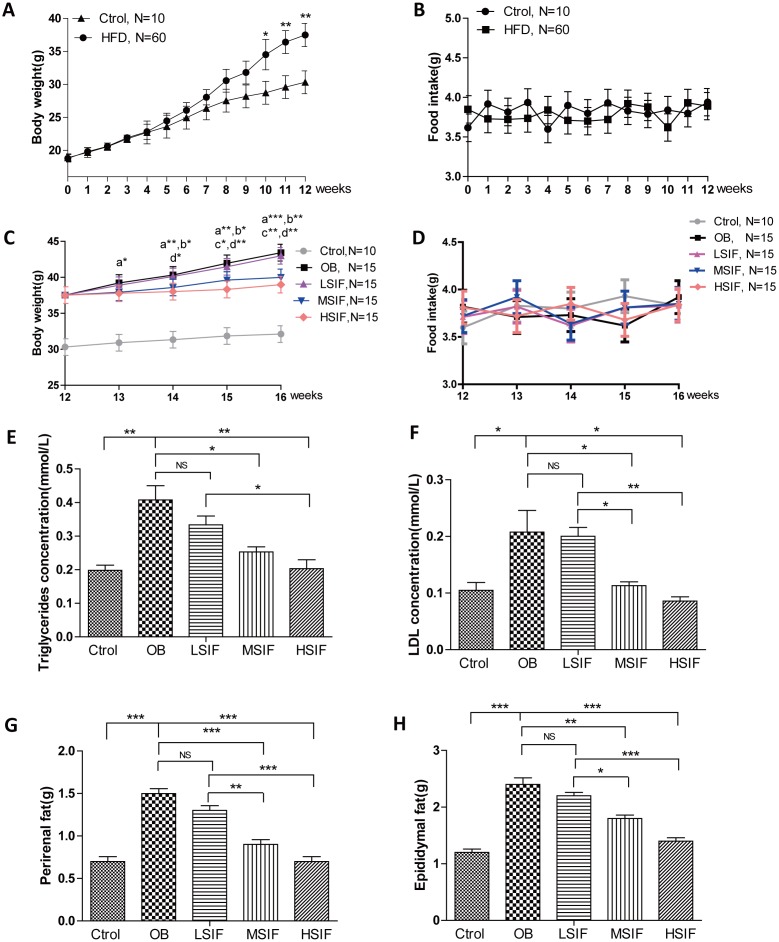
Figure 1.
Soy isoflavones reduce the body weight, the plasma TG and LDL concentrations as well as visceral fat weights in DIO male mice. (A) Quantification shows the body weight of mice fed with basal diets and high fat diets; (B) Quantification shows no difference in food intake of mice fed with basal diets and high fat diets; (C) Quantification shows the body weight trend of DIO mice fed with basal diets and the addition with different doses of soy isoflavones. a: HSIF vs. OB; b:MSIF vs. OB. c: LSIF vs. MSIF; d: LSIF vs. HSIF. (D) Quantification shows the food intake trend of DIO mice fed with basal diets and the addition with different doses of soy isoflavones. (E) Quantification shows the triglycerides concentration of DIO mice feed with basal diets and the addition with different doses of soy isoflavones; (F) Quantification shows the LDL concentration of DIO mice fed with basal diets and the addition with different doses of soy isoflavones. (G) Quantification shows the perirenal fat weight of DIO mice fed with basal diets and the addition with different doses of soy isoflavones; (H) Quantification shows the epididymal fat weight of DIO mice fed with basal diets and the addition with different doses of soy isoflavones. ns, no statistical significance, * p < 0.05, ** p < 0.01, ***p < 0.001.

