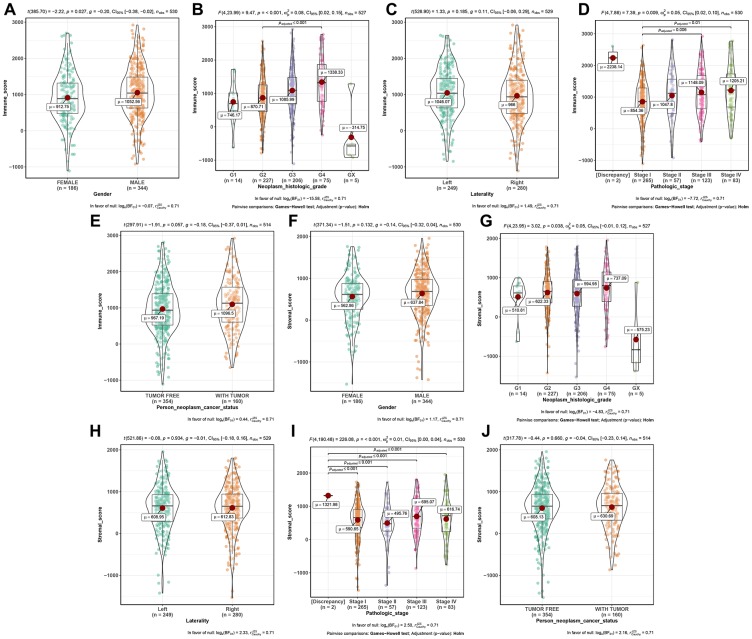
Figure 1.
Distribution of immune scores of gender (A), neoplasm histologic grade (B), laterality (C), pathologic stage (D), and person neoplasm cancer status (E). Distribution of stromal scores of gender (F), neoplasm histologic grade (G), laterality (H), pathologic stage (I), and person neoplasm cancer status (J).

