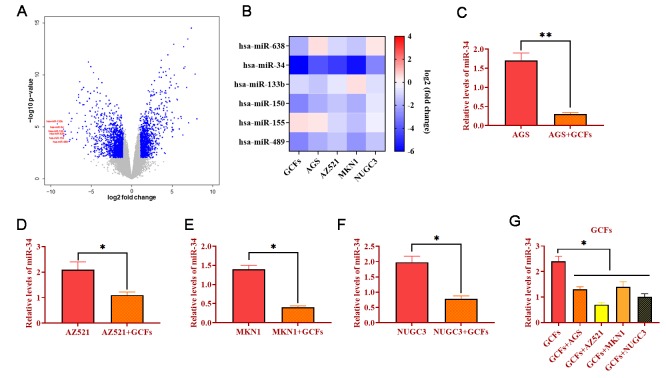
Figure 2.
MiRNA-34 is downregulated in GC fibroblasts (GCFs) and GC cell lines. (A) Volcano plot of miRNA profile in GC fibroblasts, as determined by microarray analysis. (B) Heat map of expressions of miRNAs that were decreased in GCFs and GC cell lines, as determined by qRT-PCR. (C–F) The expression of miRNA-34 in GC cell line AGS, AZ521, MKN1, and NUGC3 cocultured with GCFs. (G) The expression of miRNA-34 in GCFs and four GC cell lines AGS, AZ521, MKN1, and NUGC3. Values are means ± SD; *, P < 0.05; **, P < 0.01.

