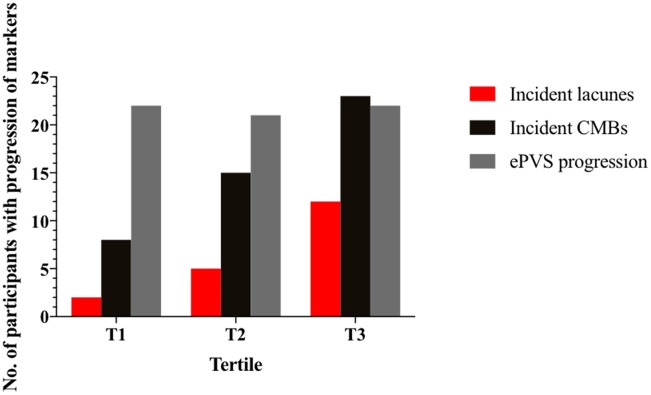
Figure 2.
Number of participants with progression of markers from baseline by tertile of baseline WMH volume. Number of participants with incident lacunes, incident CMBs and ePVS progression were shown in columns by tertile of baseline WMH volume. Red column is the number of participants with incidents lacunes; black column is the number of participants with incidents CMBs; grey column is the number of participants with ePVS progression. Participants in T1 had the least progression of markers and those in T3 had the most progression of markers. CMBs = cerebral microbleeds; ePVS = enlarged perivascular spaces.

