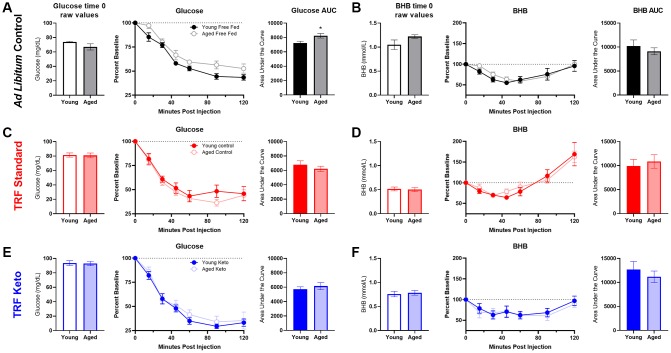
Figure 6.
Insulin tolerance test (ITT) following 8 weeks of dietary implementation. (A) Replicating figure 4, at the 8 week time point there was a significant increase in the area under the curve for glucose in aged rats relative to young while fed ad libitum chow. (B) No differences in BHB were observed. (C, D) Neither glucose nor BHB values significantly differed across young and aged rats on the SD (E, F) nor the KD in response to a bolus of insulin injected intraperitoneally. Data are represented as group mean {plus minus}1 SEM. * p = < 0.05. In panel A: ad libitum n = 6 young, n = 5 aged. In panel B: TRF standard diet n = 7 young, n = 7 aged; TRF ketogenic diet n = 7 young, n = 6 aged.

