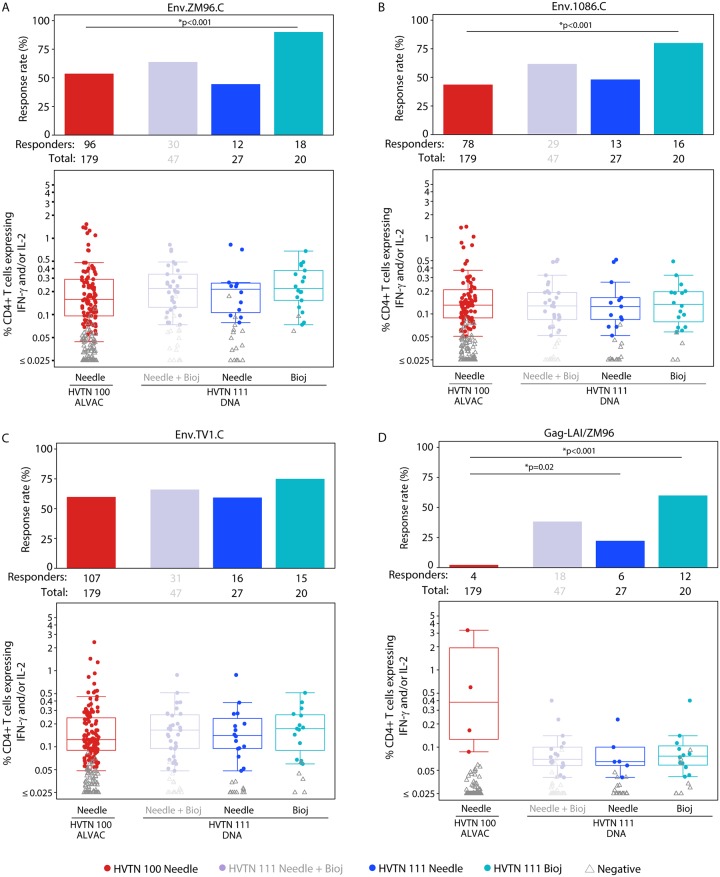
Fig 5. CD4+ T-cell responses to vaccine-matched antigens among per-protocol vaccine recipients at month 6.5.
Bar charts show the observed, unadjusted positive response rates. Boxplots show observed responses and are based on positive responders only (shown as colored circles), negative responders are shown as grey triangles. *TMLE p-values reported; Barnard p-values < 0.011. HVTN 100 is compared to both the needle and Biojector arms of HVTN 111 (shown in blues) and is therefore not compared to combined arms of HVTN 111 (grayed out). Env, envelope; HVTN, HIV Vaccine Trials Network; IFN-γ, interferon gamma; IL-2, interleukin 2; TMLE, targeted minimum loss estimation.

