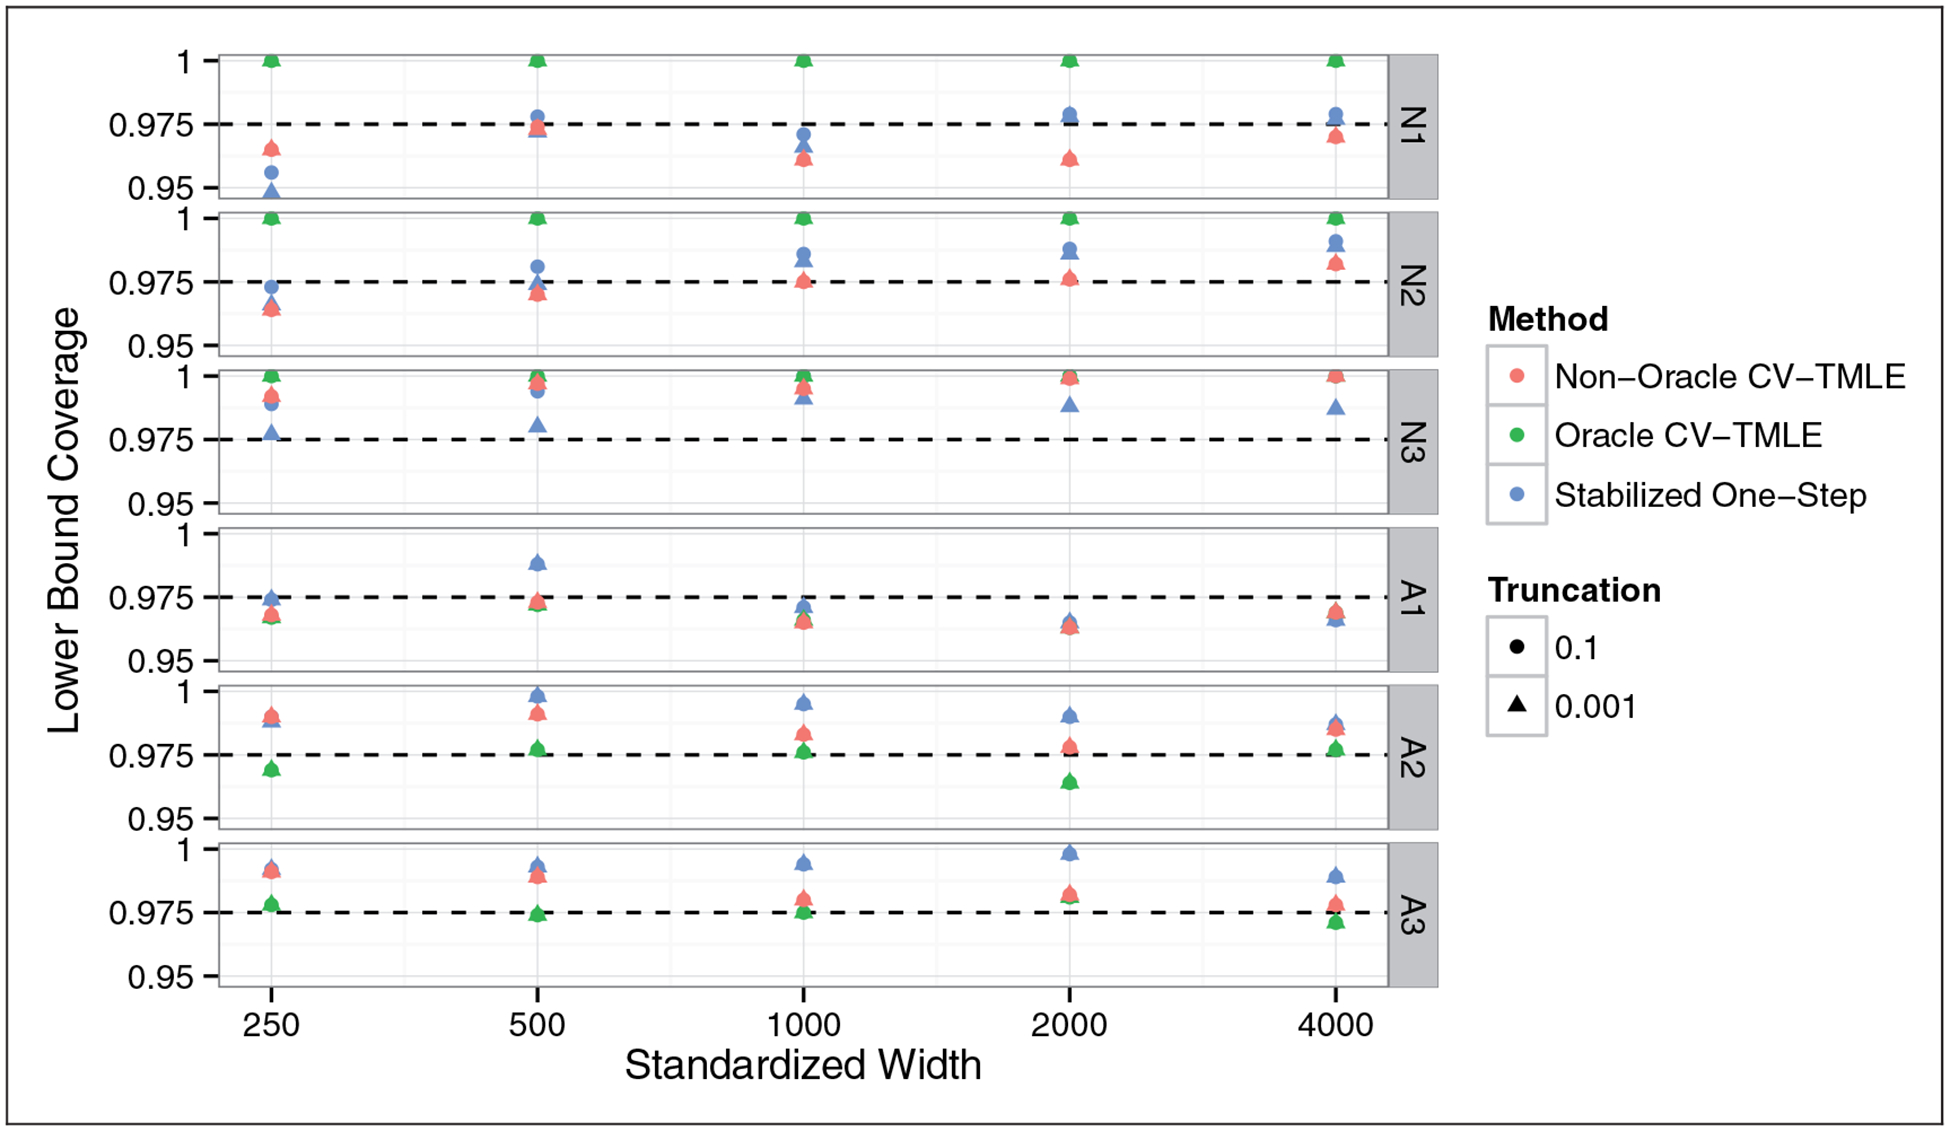
Figure 1.

Coverage of 97.5% lower confidence intervals for the impact of treating the optimal subgroup versus sample size. Horizontal axis on a log scale. All methods (approximately) achieve nominal coverage, with the stabilized one-step and non-oracle CV-TMLE generally being conservative.
