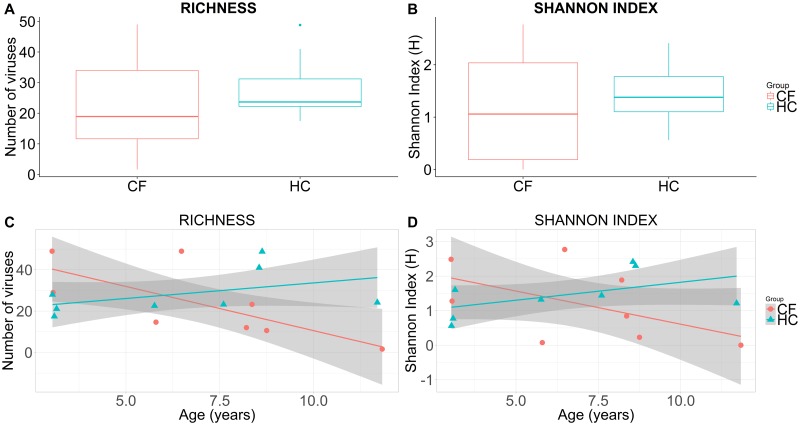
Fig 1.
Boxplots of sample richness (number of unique viruses) (A) and Shannon index (B) in CF and HC cohorts. Scatterplots of sample richness (number of unique viruses) (C) and Shannon index (D) against age in CF and HC cohorts. Cohort mean and 95% confidence intervals are constructed from generalised linear models and presented as lines and shaded regions, respectively (C, D).

