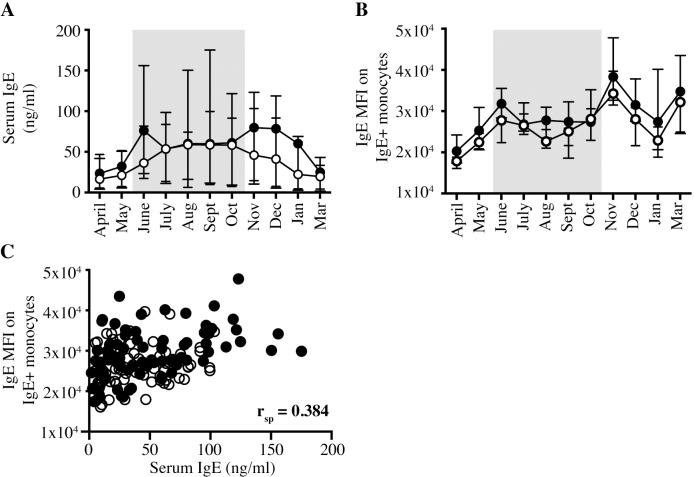
Fig 5. Serum total IgE concentration and monocyte surface IgE density are similar between allergic and nonallergic horses.
Total IgE in serum and on monocytes was measured and compared between allergic and nonallergic horses. Graphs compare allergic (closed circles, ●, n = 7) and nonallergic (open circles, ○, n = 7) horses. Months with Cul exposure and clinical signs in allergic horses are denoted by bolded months and a gray shaded box. (A) Serum total IgE concentration (ng/ml). (B) IgE Median Fluorescence Intensity (MFI) on IgE-binding monocytes (IgE+/CD14low). (C) The correlation between serum total IgE concentration and IgE MFI on IgE-binding monocytes was compared for all horses at all time points tested (April 2018 –March 2019).

