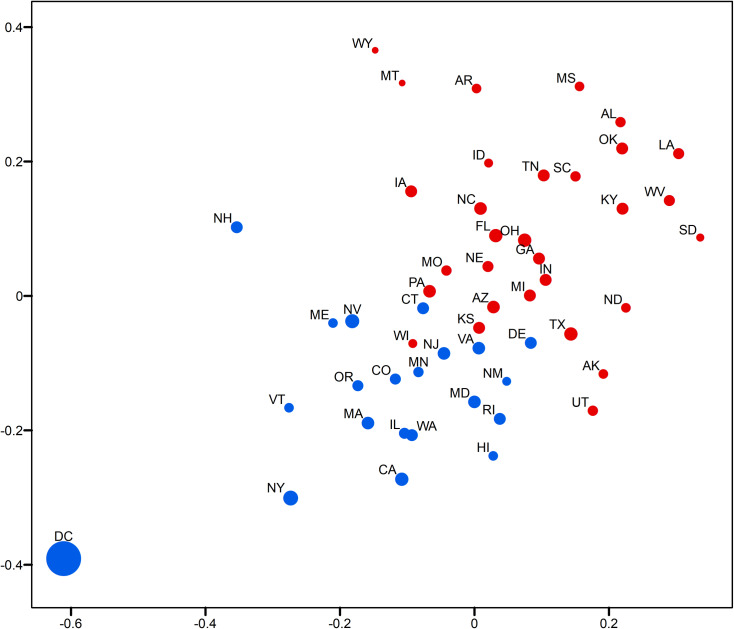
Fig 6. Two-dimensional MDS representation of the relative opinion space with the ratio of number of Twitter users captured in the data to the size of population for each state and color-coded by the 2016 US presidential election results.
Red means vote for Trump; Blue means vote for Clinton. A larger circle means larger ratio.

