Fig 7.

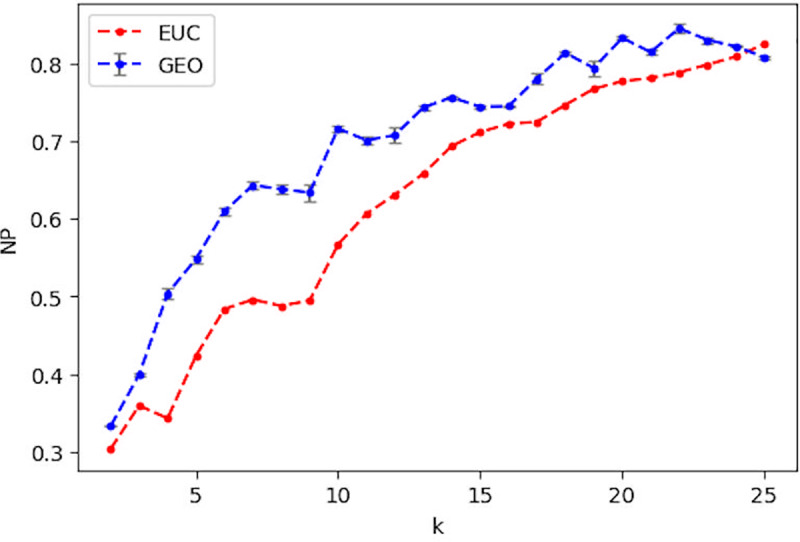
Comparison of NP when using the euclidean distance (EUC) and the average NP when using the geodesic distance (GEO) over a range of k. The grey bar indicates the standard deviation for 50 runs of NP with GEO.

Comparison of NP when using the euclidean distance (EUC) and the average NP when using the geodesic distance (GEO) over a range of k. The grey bar indicates the standard deviation for 50 runs of NP with GEO.