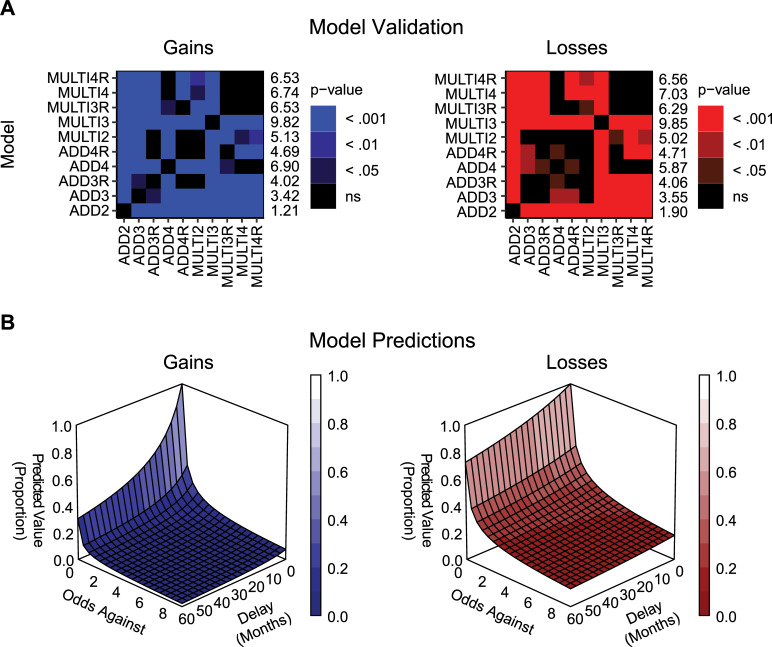
Fig 1. Results of Experiment 1.
(a) Pairwise comparisons of model RMSE, derived from the difference between the observed and predicted indifference points values at each delay and odds against combination, in the domain of gains or losses for each model and participant. Numbers on the right of the panels represent mean ranks of RMSE. The higher the rank, the lesser was the spread of prediction errors in fits of given model (lower RMSE). The numbers to the right of each plot correspond to mean rank across participants for that model. (b) Values predicted by the three-parameter multiplicative model with the amount, the odds against and delay of the outcome scaled (MULTI3, Eq 10) as a function of outcome delay and odds against in gains or losses. Median parameter estimates for the MULTI3 model were used to produce each plot. Median values were: k = 0.10, h = 7.28, s = 0.61 in the domain of gains and k = 0.02, h = 6.99, s = 0.41.

