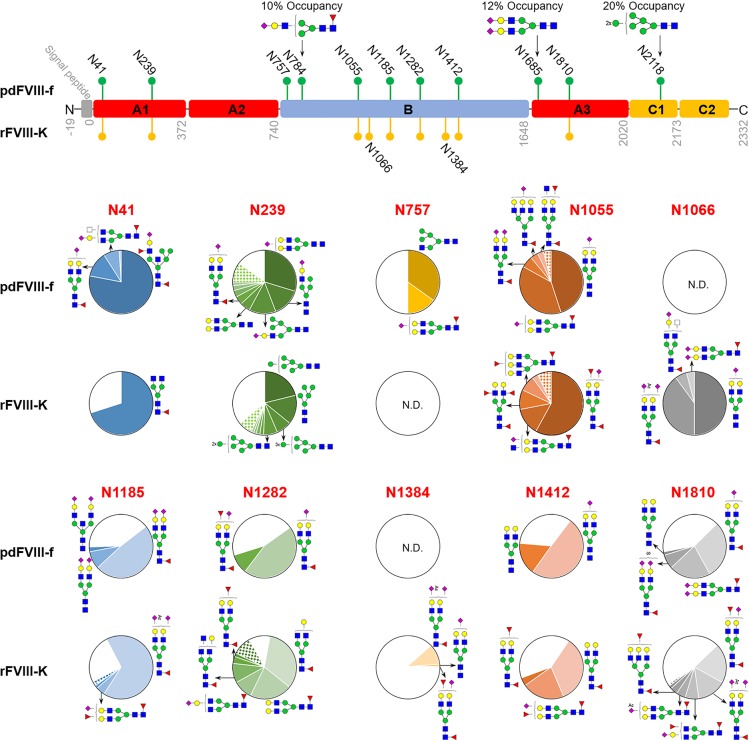
Fig 3. Comparison of N-glycosite localization and glycoform abundance between rFVIII-K and pdFVIII-f.
The sites identified in rFVIII-K were labeled orange while those in pdFVIII-f in green. Site-specific N-glycosylation analysis with occupancy and relative abundance were shown in pie charts. White pie, not glycosylated; colored pie, the abundance of each glycoform; patterned pie, the total abundance of remaining glycoforms on this site.

