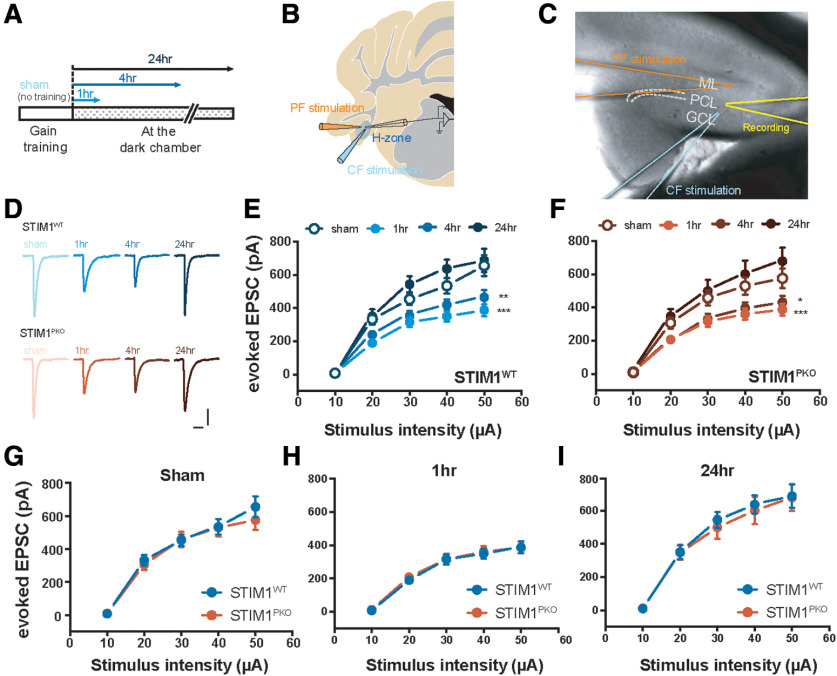
Figure 2.
Reduced responses of PF-PC synapses after gain-up learning. A, Experimental scheme. The floccular slices were made 1, 4, and 24 h after VOR gain-up training, and sham animal underwent the same procedure to experimental groups without training session. B, Illustration of the flocculus. We placed stimulating electrode to one-third from the top of molecular layer. The electrophysiological recordings were performed from the PCs located at the H zone. C, Image showing the recording sites. D, Representative eEPSC traces of both genotype groups at each time point. Calibration: 200 pA, 30 ms. E, Amplitude of eEPSC by serial PF stimulation in WT littermates. In comparison with sham group (n = 9), amplitude was significantly reduced at 1 and 4 h after learning (at 50 μA injection; 1 h, n = 19, p < 0.001; 4 h, n = 9, p = 0.002), and depressed amplitude was recovered 24 h later (at 50 μA injection; 24 h, n = 8, p = 0.922). F, Amplitude of eEPSC by serial PF stimulation in STIM1PKO. As with WT littermates, the amplitude was considerably decreased at 1 and 4 h later, and restored at 24 h after learning (at 50 μA injection; sham, n = 14; 1 h, n = 14, p < 0.001; 4 h, n = 14, p = 0.013; 24 h, n = 7, p = 0.232). G, Comparison of eEPSC in sham group from both genotypes. In sham group, amplitude of eEPSC in STIM1WT was compatible to STIM1PKO. H, Comparison of eEPSC at 1 h after training from both genotypes. In this 1 h group time point, amplitude of eEPSC in STIM1WT was comparable with STIM1PKO. I, Comparison of eEPSC at 24 h after training group in both genotypes. In this time point, amplitude of eEPSC in STIM1WT was comparable with STIM1PKO. E, F, Two-way repeated-measures ANOVA. Asterisks at each time points were calculated by compared with sham groups. Error bars indicate SEM. *p < 0.05; **p < 0.01; ***p < 0.001; post hoc Sidak test for pairwise comparison.

