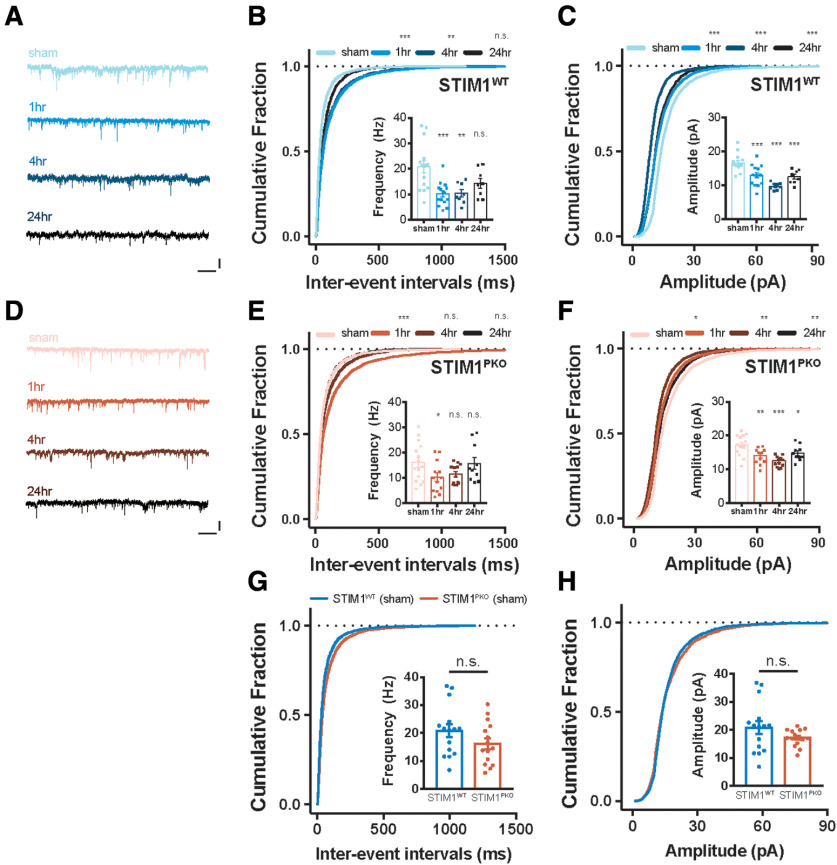
Figure 3.
LTD at the PF-PC synapses after gain-up learning. A, Representative sEPSC traces of WT group at each time point. Calibration: 25 pA, 1 s. B, Cumulative plots of IEI of sEPSC in WT littermates (sham, n = 15; 1 h, n = 15; 4 h, n = 8; 24 h, n = 8). The cumulative fractions of learning groups were right-shifted compared with sham groups, implying reduction of frequency (1 h, p < 0.001; 4 h, p = 0.002; 24 h, p = 0.872). Inset, Bar graph represents mean frequencies of sEPSC indicating depression of frequency (1 h, p < 0.001; 4 h, p = 0.002; 24 h, p = 0.074). C, Cumulative plots of amplitude of sEPSC in WT littermates. The cumulative fractions of learning groups were left-shifted compared with sham groups, implying reduction of amplitude (1 h, p < 0.001; 4 h, p < 0.001; 24 h, p < 0.001). Inset, Bar graph represents mean amplitudes of sEPSC, indicating that depression of amplitude was maintained for 24 h after learning (1 h, p < 0.001; 4 h, p < 0.001; 24 h, p < 0.001). D, Representative sEPSC traces of STIMPKO group at each time point. Calibration: 25 pA, 1 s. E, Cumulative plots of IEI of sEPSC in STIMPKO mice (sham, n = 15; 1 h, n = 13; 4 h, n = 13; 24 h, n = 10). The cumulative fraction of 1 h after learning was right-shifted (1 h, p < 0.001), but most of changes returned to sham level from 4 and 24 h after training (4 h, p = 0.998; 24 h, p = 0.405). Inset, Summarizing bar graph of sEPSC frequency, implying that frequency of sEPSC was transiently depressed at 1 h and recovered from 4 h after learning (1 h, p = 0.048; 4 h, p = 0.131; 24 h, p = 0.997). F, Cumulative plots of amplitude of sEPSC in STIMPKO mice. The cumulative fractions of learning groups were more left-shifted than sham groups (1 h, p = 0.041; 4 h, p = 0.003; 24 h, p = 0.003). Inset, Bar graph represents that amplitude of sEPSC was depressed and maintained for 24 h after learning (1 h, p = 0.003; 4 h, p < 0.001; 24 h, p = 0.040). G, Cumulative plots of IEI of sEPSC in WT (blue, n = 15) and STIM1PKO mice (red, n = 15). The cumulative fraction of IEI and bar graph (inset) of sEPSC frequency indicated that frequency of sEPSC was not changed in STIM1PKO compared with WT littermates (cumulative plot, p = 0.370; bar graph, p = 0.145). H, Cumulative plots of amplitude of sEPSC. The cumulative fraction of amplitude and bar graph (inset) of sEPSC frequency indicated that amplitude of sEPSC was not changed in STIM1PKO compared with WT littermates (cumulative plot, p = 0.998; bar graph, p = 0.587). B, C, E-H, Kolmogorov-Smirnov test was used for comparing cumulative plots. B, C, E, F, One-way ANOVA with post hoc Dunnett test was used for inset bar graphs. G, H, Unpaired t test was used for inset bar graphs. Error bar indicates SEM. Asterisks at each time points were calculated by comparing to sham groups. Error bars indicate SEM. *p < 0.05; **p < 0.01; ***p < 0.001. n.s., not significant.

