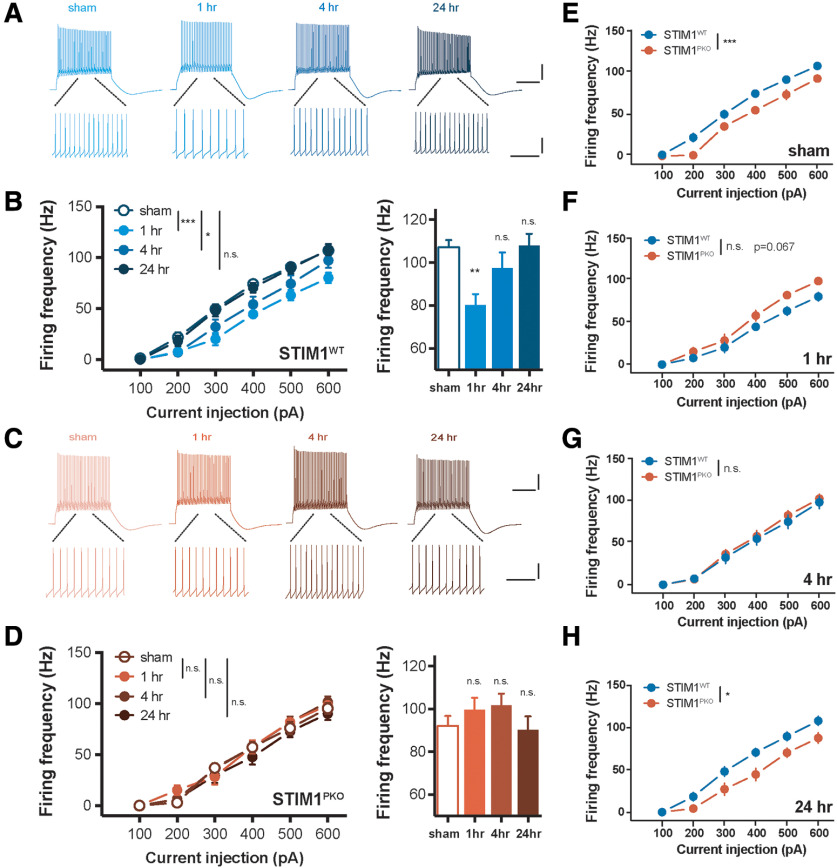
Figure 4.
VOR adaptation also induces plastic change of IE in PCs. A, Representative traces from whole-cell recording in WT group. Calibration (top): 20 mV, 200 ms. Calibration (bottom): 20 mV, 50 ms. B, PC excitability of WT littermates over several time points. VOR adaptation decreased gain responses of the cerebellar PCs in response to square-wave current injection ranging from 100 to 600 pA for 500 ms (sham vs 1 h, p < 0.001; sham vs 4 h, p = 0.024; sham vs 24 h, p = 0.717, left; sham, n = 20; 1 h, n = 11; 4 h, n = 16; 24 h, n = 20). Excitability in 600 pA injection was significantly decreased at short-term (1 h, p = 0.006), mostly recovered at mid-term (4 h, p = 0.424), and fully recovered at long-term (24 h, p = 0.999). C, Representative traces from whole-cell recording in STIM1PKO group. Calibration (top), 20 mV, 200 ms. Calibration (bottom), 20 mV, 50 ms. D, Excitability of PC in STIM1PKO. Different from WT littermates, STIM1PKO showed no alteration of excitability after learning (sham vs 1 h, p = 0.370; sham vs 4 h, p = 0.343; sham vs 24 h, p = 0.768, left; sham, n = 17; 1 h, n = 13; 4 h, n = 17; 24 h, n = 13). There were no significant changes in 600 pA injection (1 h, p = 0.696; 4 h, p = 0.401; 24 h, p = 0.991). E, STIM1PKO group (n = 17) showed significantly lower excitability than WT littermates (n = 20, p < 0.001). F, While the excitability of STIM1PKO (n = 13) was unchanged, excitability of WT littermates (n = 11) was decreased (p = 0.067). G, At 4 h after learning, the altered excitability of WT littermates (n = 16) partly restored, and overlapped to excitability of STIM1PKO (n = 17), which was still unchanged (p = 0.644). H, As the excitability of WT littermates (n = 20) was fully recovered, significant difference from STIM1PKO group (n = 13) was also restored (p = 0.022). B, D-H, Two-way repeated-measures ANOVA with post hoc Sidak test was used for injected current-frequency and bar graphs. B, D, One-way ANOVA with post hoc Dunnett test was used for bar graphs. Asterisks at each time points were calculated by comparing with sham groups. Error bars indicate SEM. *p < 0.05; **p < 0.01; ***p < 0.001. n.s., not significant.

