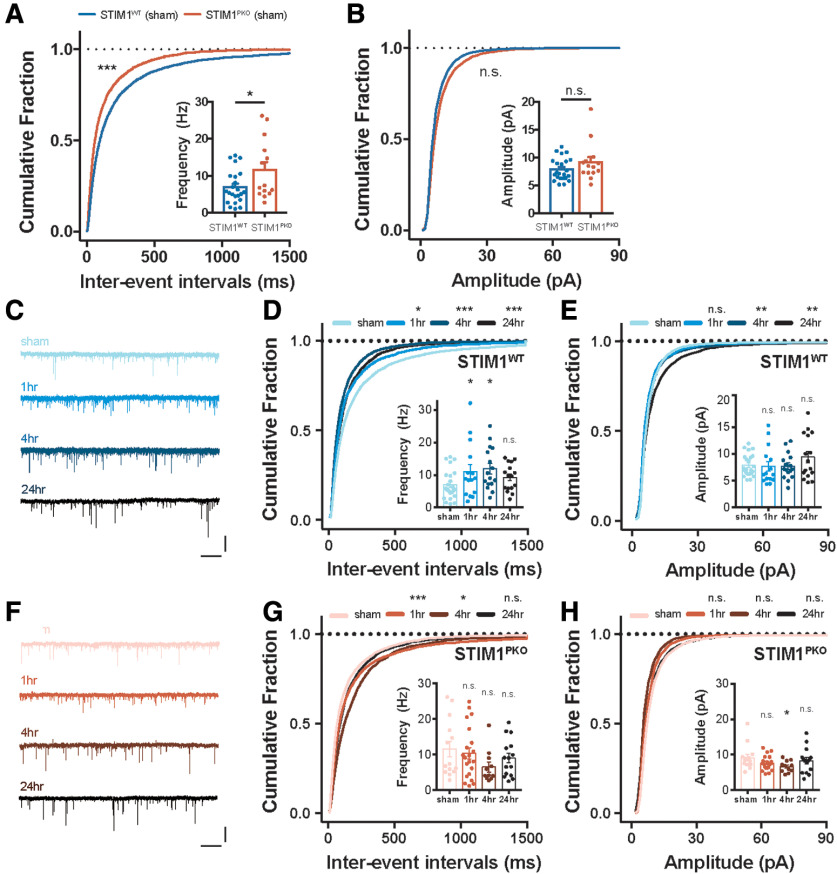
Figure 6.
VOR gain-up learning induced LTP of the excitatory input in VN neurons. A, Frequency of synaptic transmission in VN neurons from WT littermates (n = 23, blue) and STIM1PKO mice (n = 14, red). The cumulative fraction of IEI and bar graph (inset) of sEPSC frequency indicated that frequency of sEPSC was higher in STIM1PKO compared with WT littermates (cumulative plot, p < 0.001; bar graph, p = 0.032). B, Amplitude of sEPSC in VN neurons from WT littermates (blue) and STIM1PKO mice (red). The cumulative fraction of amplitude and bar graph (inset) of sEPSC frequency indicated that amplitude of sEPSC was not changed in STIM1PKO compared with WT littermates (cumulative plot, p = 0.180; bar graph, p = 0.161). C, Representative sEPSC traces of WT group at each time point. Calibration: 25 pA, 1 s. D, IEI of sEPSC in WT mice (sham, n = 23; 1 h, n = 15; 4 h, n = 16; 24 h, n = 16). The cumulative distributions of IEI were left-shifted after learning (1 h, p = 0.019; 4 h, p < 0.001; 24 h, p < 0.001). The mean frequency of sEPSC was significantly potentiated at 4 h after training (inset; 4 h, p = 0.035). Although 1 and 24 h groups were significant in cumulative plot, these groups were not statistically significant in mean value (inset; 1 h, p = 0.116; 24 h, p = 0.503). E, Amplitude of sEPSC in WT mice. The cumulative distribution was significantly right-shifted only at 24 h after learning (1 h, p = 0.281; 4 h, p = 0.994; 24 h, p = 0.002). There was trend of potentiation at 24 h after training, but overall, the amplitude of sEPSC was not significantly affected by learning (inset bar graph; 1 h, p = 0.995; 4 h, p = 0.997; 24 h, p = 0.281). F, Representative sEPSC traces of STIM1PKO group at each time point. Calibration: 25 pA, 1 s. G, IEI of sEPSC in STIMPKO mice (sham, n = 14; 1 h, n = 21; 4 h, n = 11; 24 h, n = 15). In contrast to WT littermates, the cumulative distribution was significantly right-shifted at 1 and 4 h after learning, which is opposite direction of WT littermates (1 h, p < 0.001; 4 h, p = 0.040; 24 h, p = 0.408). The mean frequency of sEPSC was not significantly altered after learning (inset bar graph; 1 h, p = 0.921; 4 h, p = 0.162; 24 h, p = 0.617). H, Cumulative plots of amplitude of sEPSC in STIMPKO mice. The cumulative distribution was not significantly changed after learning (1 h, p = 0.468; 4 h, p = 0.699; 24 h, p = 0.906). The amplitude of sEPSC was not significantly changed after learning (inset bar graph; 1 h, p = 0.528; 4 h, p = 0.076; 24 h, p = 0.756). A, B, D, E, G, H, Kolmogorov-Smirnov test was used for comparing cumulative plots. A, B, Unpaired t test was used for inset bar graphs. D, E, G, H, One-way ANOVA with post hoc Dunnett test was used for inset bar graphs. Asterisks at each time point were calculated by comparing with sham groups. Error bars indicate SEM. *p < 0.05; **p < 0.01; ***p < 0.001. n.s., not significant.

