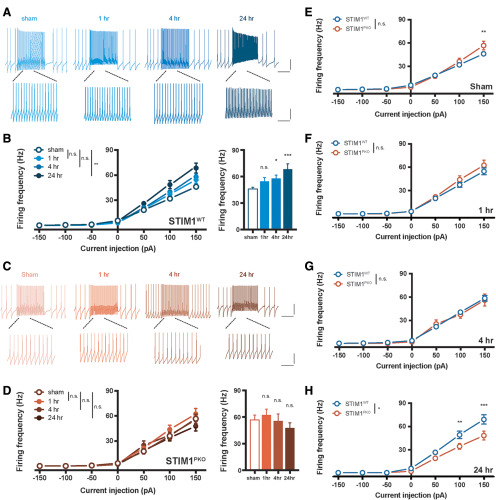
Figure 7.
VOR gain-up learning induced potentiation of IE in VN neurons. A, Representative traces from whole-cell recordings of the WT group at each time point. Calibration (top): 20 mV, 500 ms. Calibration (bottom): 20 mV, 125 ms. B, The excitability of VN neurons in WT littermates. VOR adaptation significantly potentiated gain of the VN neurons in response to square-wave current injection ranging from −150 pA to 150 pA for 1 s (sham vs 1 h, p = 0.319; sham vs 4 h, p = 0.072; sham vs 24 h, p = 0.002, left; sham, n = 23; 1 h, n = 16; 4 h, n = 38; 24 h, n = 19). Excitability in 150 pA injection was elevated but not significantly at 4 h (p = 0.082) and significantly increased at 24 h (p = 0.002) after training. C, Representative traces from whole-cell recordings of WT group at each time point. Calibration (top): 20 mV, 500 ms. Calibration (bottom): 20 mV, 125 ms. D, Excitability of VN neurons in STIM1PKO mice. There was no alteration of excitability after learning (sham vs 1 h, p = 0.422; sham vs 4 h, p = 0.801; sham vs 24 h, p = 0.493, left; sham, n = 17; 1 h, n = 25; 4 h, n = 15; 24 h, n = 15), and no significant changes in 150 pA injection as well (1 h, p = 0.864.; 4 h, p = 0.999; 24 h, p = 0.697). E, Overall, the gain responses of VN neurons from STIM1PKO mice (n = 16) were not significantly different from WT littermates (n = 23, p = 0.423); but at 150 pA injection, STIM1PKO mice showed higher excitability than WT littermates (p = 0.003). F, At the short-term period, the excitability of VN neurons of the WT (n = 16) had slightly increased, whereas the excitability of STIM1PKO (n = 25) was unchanged. Statistical difference had disappeared (p = 0.428). G, At 4 h after learning, the excitability of VN neurons of the WT (n = 38) increased more, and that of STIM1PKO (n = 15) was again unchanged. IO curves of both groups are overlapped (p = 0.759). H, As the excitability of WT littermates (n = 19) became much higher at the long-term period, the WT group showed significant higher frequency than STIM1PKO group (n = 15) (p = 0.016). At 100 and 150 pA injection, statistical significance was 0.005 (100 pA) and <0.001 (150 pA) by post hoc Sidak test. B, D-H, Two-way repeated-measures ANOVA with post hoc Sidak test was used for injected current-frequency and bar graphs. B, D, One-way ANOVA with post hoc Dunnett test was used for bar graphs. Asterisks at each time points were calculated by comparing with sham groups. Error bars indicate SEM. *p < 0.05; **p < 0.01; ***p < 0.001. n.s., not significant.

