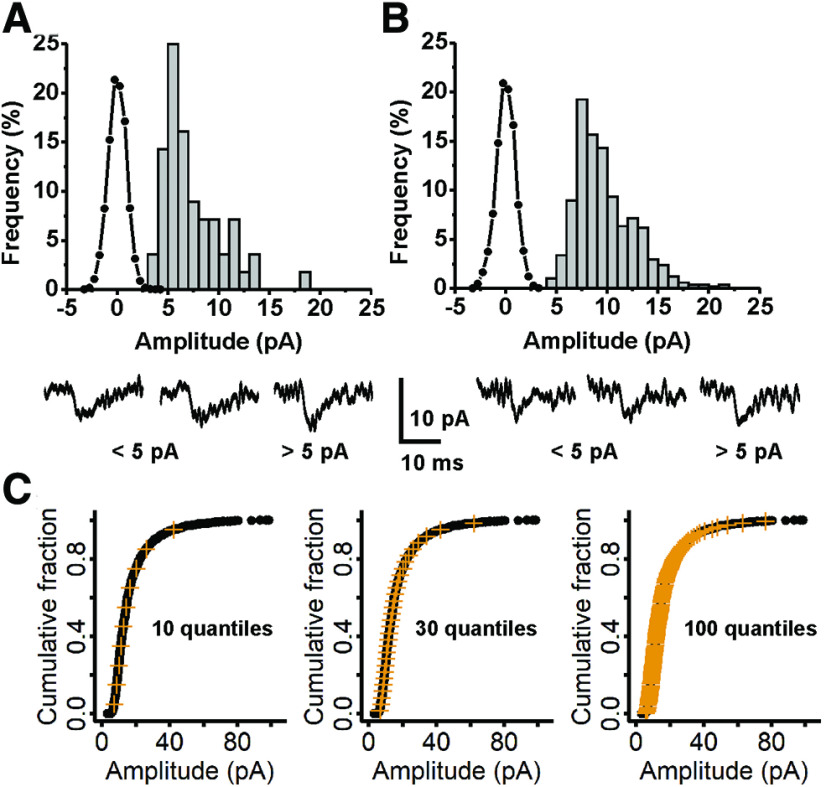
Figure 2.
Analysis of noise, detection of mEPSCs <5 pA, and demonstration of quantile sampling. A, Data from cell C0220000, mean amplitude 7.4 pA, 56 events. This cell had the highest percent of mEPSCS under 5 pA (10/56, 17.9%). The frequency histogram for currents in regions of the recording without mEPSCs (line and black circles) does not significantly overlap with the frequency histogram of mEPSCs detected by MiniAnalysis (gray bars). Below, current traces for three selected mEPSCs, two of which were below 5 pA and one which was slightly above. The mEPSCs have the following characteristics, left to right: 4.40 pA, 1.6-ms rise time, 5.5-ms decay; 4.15 pA, 1.5-ms rise time, 8.9-ms decay; 6.23 pA, 1.5-ms rise time, 4.1-ms decay. B, Data from cell D0512005, mean amplitude 9.7 pA, 504 events. Approximatley 1% of mEPSCs were below 5 pA (5/504). The noise histogram (line and black circles) is very similar to that of C0220000, although the two recordings were made more than a year apart; it does not overlap with the frequency histogram for mEPSCs detected by MiniAnalysis. Below, three selected mEPSCs, two below 5 pA and one above, with the following characteristics, left to right: 4.52 pA, 1.0-ms rise time, 2.4-ms decay; 4.88 pA, 2.3-ms rise time, 2.9-ms decay; 6.29 pA, 1.5-ms rise time, 2.8-ms decay. C, The cumulative distribution function (CDF) for amplitudes of mEPSCs recorded from cell E0324002 is shown as black circles, overlaid with 10 quantiles, 30 quantiles, and 100 quantiles, shown as vermilion crosses.

