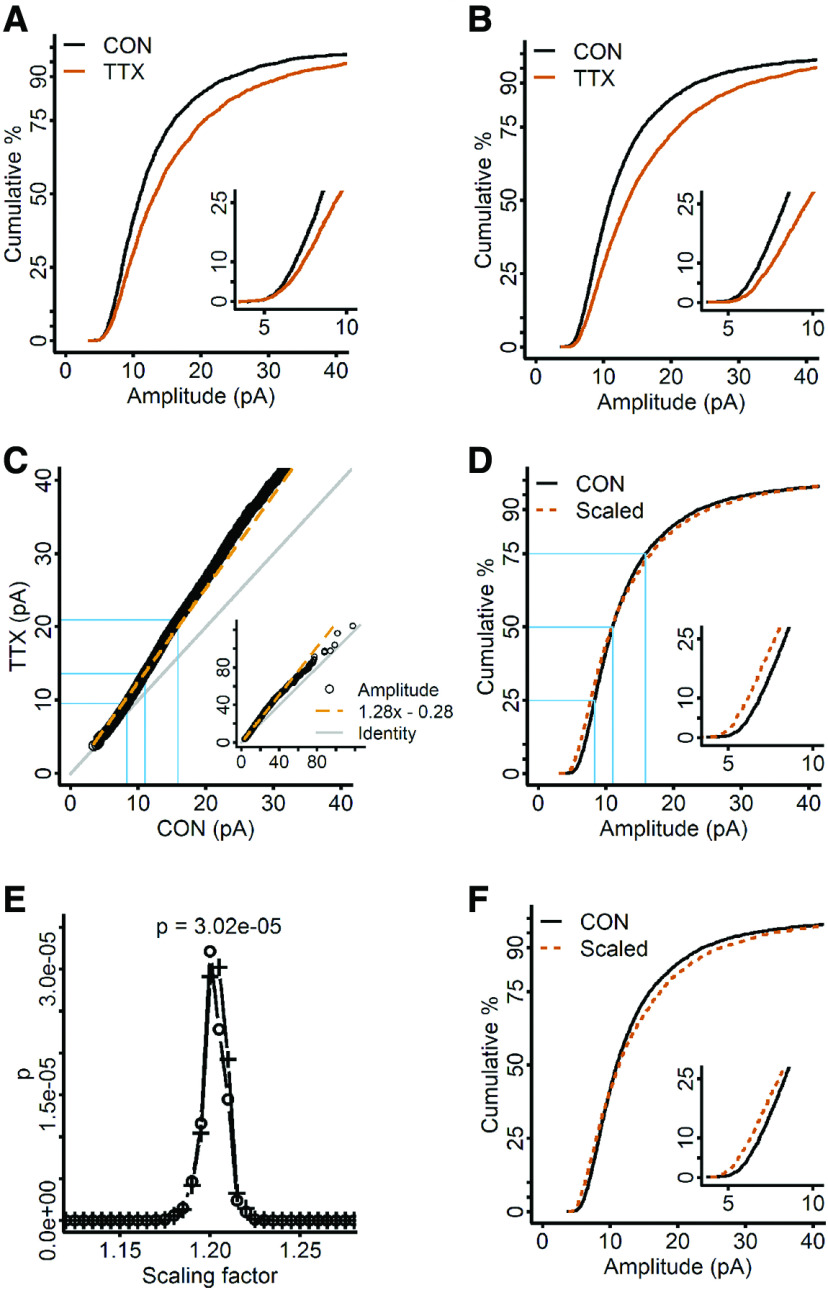
Figure 3.
Homeostatic plasticity in dissociated mouse cortical neurons is not well-described by the parameters obtained from the rank-order process, nor the single multiplication factor obtained by an iterative process. A, CDFs produced by randomly sampling 30 mEPSCs from each untreated (CON, black) and TTX-treated cell (TTX, vermilion). B, CDFs produced by computing 30 quantiles from the mEPSC distributions of each control (black) and TTX-treated cell (vermilion). C, Rank-order plot. To create identical size datasets as required, 77 quantiles were computed from each control cell, and 86 quantiles were computed from each TTX cell; the rank-order plot was obtained by sorting from smallest to largest amplitude in control and TTX data and plotting them against each other. A linear regression fit is shown in long vermilion dashes. D, Control CDF compared with TTX CDF after scaling (short dashes) using the parameters obtained from the linear regression fit of the rank-order plot in C; n, control = 2580; TTX = 2310; test statistic = 0.070, p = 1.3 × 10⁻⁵, K–S test. E, Scaling factors were chosen iteratively, used to downscale the TTX distribution, followed by discarding subthreshold amplitudes below 4.01 pA (smallest control mEPSC quantile), and the scaled distribution was compared with control with a K–S test to produce the corresponding p value. Crosses, Below-threshold events were discarded. Circles, Below threshold events were not discarded. Test statistic = 0.053, p = 3.0 × 10⁻⁵, K–S test. F, The scaling factor that produced the largest p value in E, 1.19, was used to downscale the TTX distribution (dashed vermilion curve) to the control (black curve); two events were discarded. Insets in A, B, D, F, Blow up of the low end of the data. Inset in C, Full range of the data. Line of identity is indicated in gray. Blue lines in C, D indicate the 25th, 50th, and 75th percentiles of the data.

