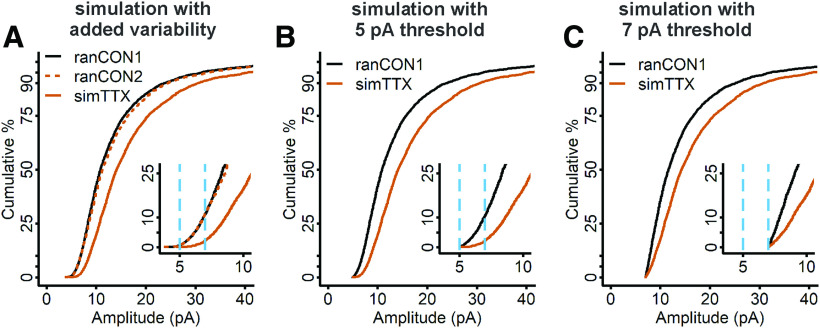
Figure 4.
Empirical simulations of uniform multiplicative scaling show that mEPSCs of TTX-treated cells are larger than those of control cells from the lowest percentiles of the distributions; application of a detection threshold causes a small overlap. A, Two distinct control distributions (ranCON1, black curve; and ranCON2, dashed vermilion curve) were obtained by random sampling and differed on a K–S test with a test statistic = 0.039, p = 0.04. The second control distribution was multiplied by 1.25 to simulate uniform multiplicative scaling (simTTX, solid vermilion curve). B, A detection threshold of 5 pA was applied to the ranCON1 and simTTX data, meaning that all mEPSCs below 5 pA were removed from both distributions. C, A detection threshold of 7 pA was applied to the ranCON1 and simTTX data; all data below 7 pA were removed from both distributions. Insets, Blow up of the low end of the distribution. Dashed blue lines indicate the location of 5- and 7-pA cutoffs, which represent ∼2% and 10% of the control dataset, respectively.

