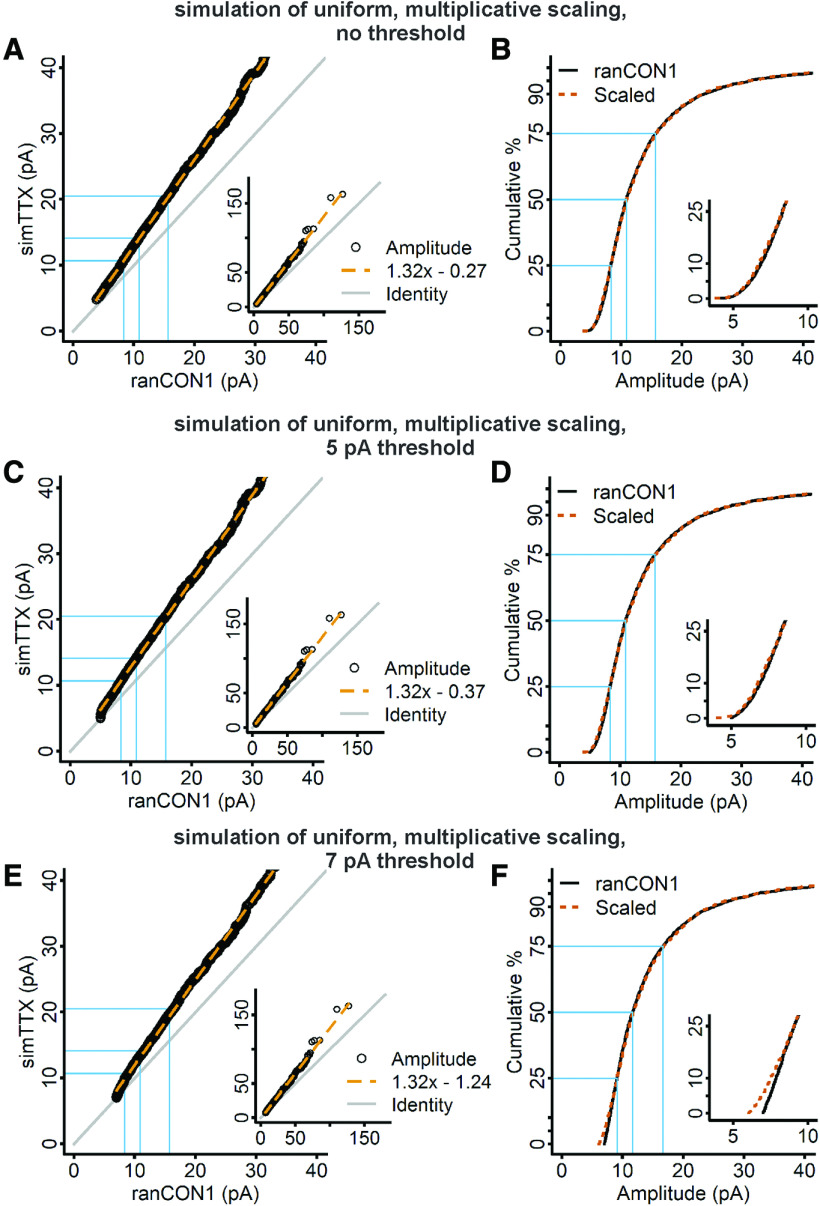
Figure 5.
The scaling transformation computed by the rank-order process detects the correct scaling factor and produces a nearly perfect fit of data simulated with multiplication by a uniform factor, and is only slightly disrupted when data have been truncated with a large detection threshold. A, RanCON1 and simTTX mEPSC amplitudes were sorted from smallest to largest and plotted against each other, and fit with a linear regression model (dashed vermilion line). B, The parameters from the linear regression fit shown in A were used to downscale the data from the TTX simulation, and produced a close match between the scaled distribution (dashed vermilion curve) and the ranCON1 data (black curve; ranCON1, n = 2610; simTTX, n = 2610; test statistic = 0.018, p = 0.77, K–S test). C, Rank-ordered mEPSCs of ranCON1 and simulated TTX cells with a detection threshold set at 5 pA, plotted against each other and fit with a linear regression model (dashed vermilion line). After removing mEPSC amplitudes < 5 pA from ranCON1 and simTTX, the samples sizes had to be rematched to be identical for the rank-order process, which was accomplished by randomly discarding mEPSCs from the now larger simTTX dataset (new n = 2594 for both control and TTX). D, The parameters from the linear regression fit shown in C were used to downscale simTTX (test statistic = 0.018, p = 0.63, K–S test). E, Rank-ordered mEPSCs of ranCON1 and simulated TTX data with a detection threshold of 7 pA, plotted against each other and fit with a linear regression model (dashed vermilion line). After removing mEPSC amplitudes < 7 pA, the sample sizes were rematched by randomly discarding from the now larger simTTX dataset (new n = 2321 for both control and TTX). F, The parameters from the linear regression fit in F were used to scale the simulated TTX data down to the ranCON1 data (test statistic = 0.047, p = 0.012, K–S test). Gray lines in A, C, E indicate the line of identity. Blue lines indicate the 25th, 50th, and 75th percentiles of the data. Insets in A, C, E, View of the entire data range. Insets in B, D, F, Blow up of the initial part of the distribution.

