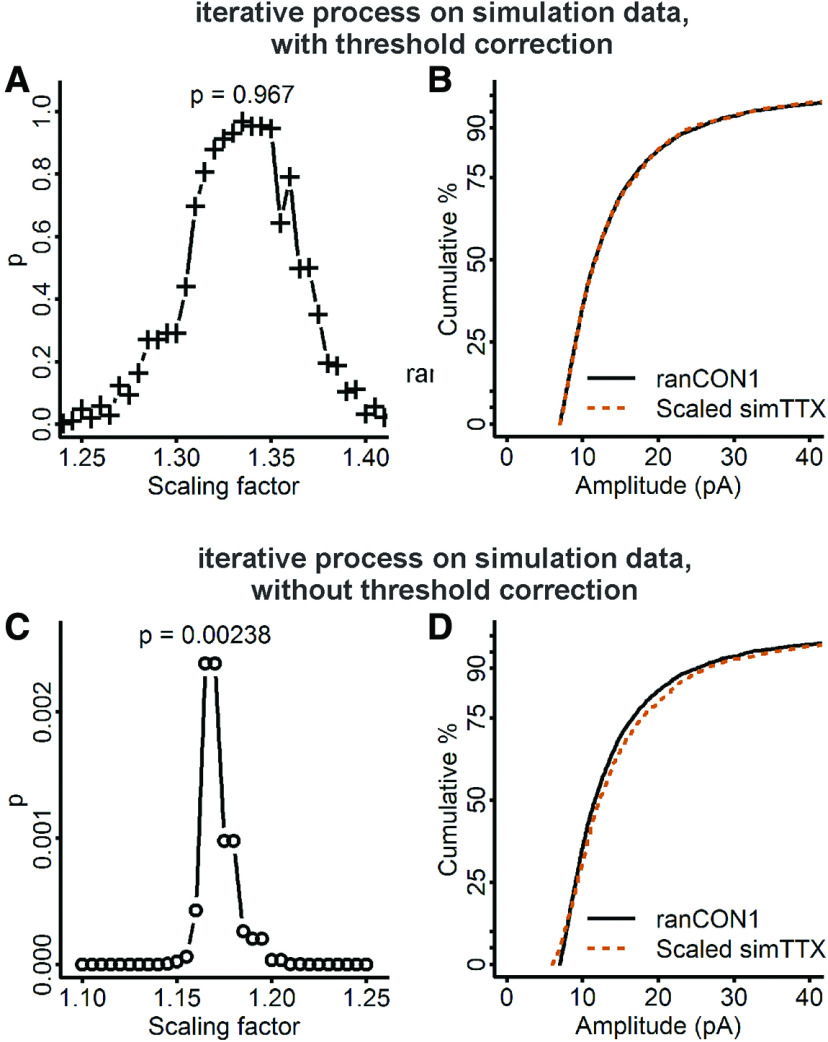
Figure 6.
Iterative selection of the scaling factor detects the expected factor with an almost perfect fit in data simulated with multiplication by a single factor and truncated by a large detection threshold. A, Each scaling factor was used to downscale the simulated TTX distribution, subthreshold events (<7 pA) were discarded from the downscaled data, and the scaled distribution was compared with simulated control with a K–S test to produce the corresponding p value. A factor of 1.335 produced a nearly perfect fit (test statistic = 0.016, p = 0.967, K–S test). B, Cumulative distributions of ranCON1 data (black curve) and scaled simTTX (downscaled by 1.335, 13 subthreshold simTTX mEPSCs removed, 5.6% of the data; dashed vermilion curve). C, When subthreshold mEPSCs were not removed, the scaling factor that produced the best fit of scaled simTTX to ranCON1 was 1.165, but the p value was much smaller than when subthreshold values were removed (test statistic = 0.056, p = 2.4 × 10⁻³, K–S test). D, Cumulative distributions of ranCON1 (black curve) and scaled simTTX (downscaled by 1.165, no events discarded; dashed vermilion curve).

