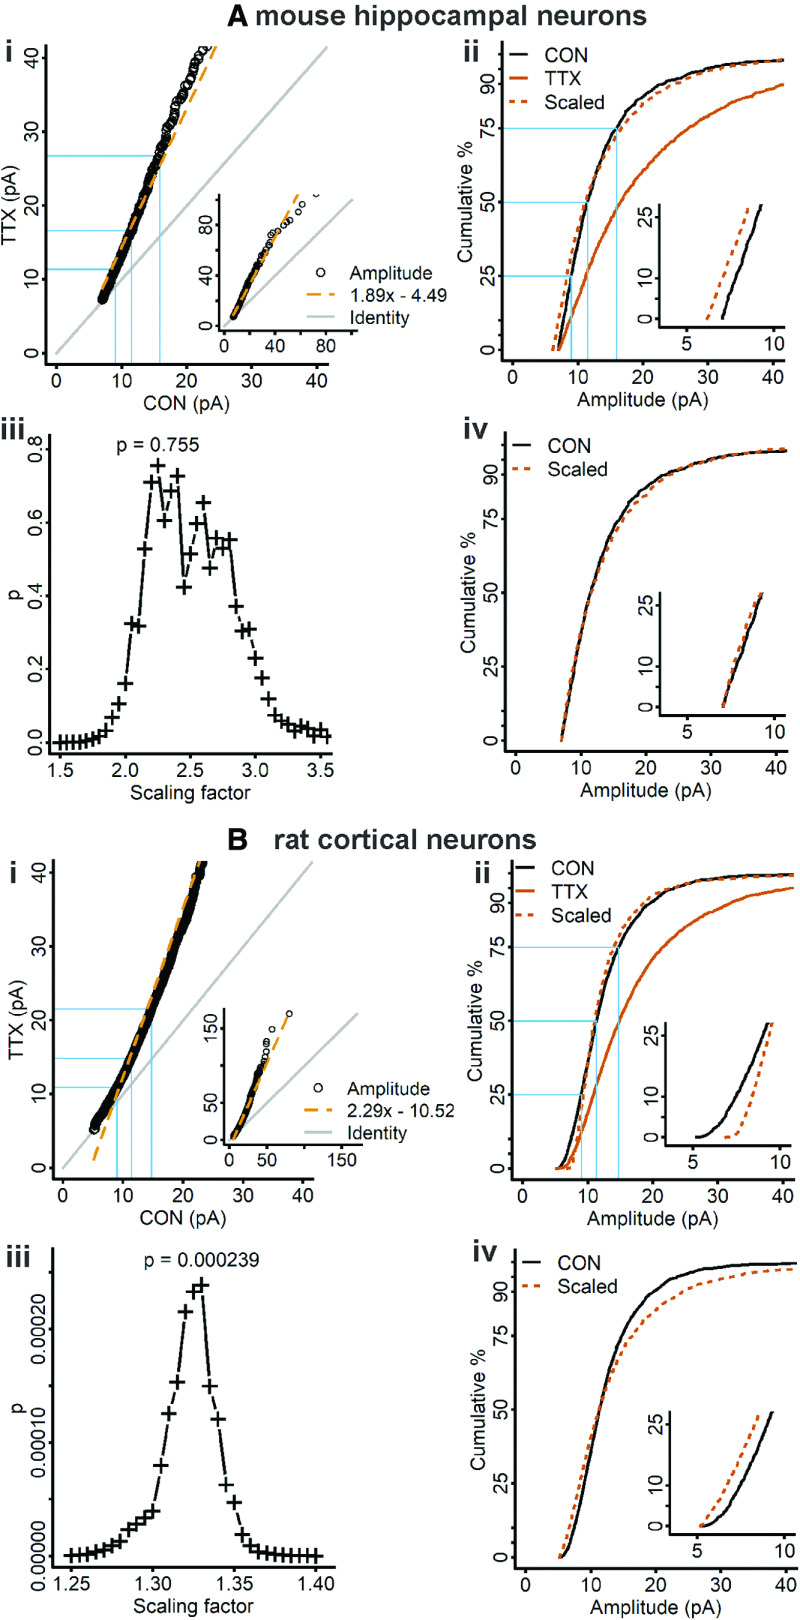
Figure 8.
Rank-order and iterative processes applied to previously published data from dissociated mouse hippocampal neurons and rat cortical neurons. Ai, Rank-order plot of mouse hippocampal neuron data, with linear regression fit (dashed vermilion line). To match the sample sizes, 20 quantiles were computed for each control cell and 18 quantiles for each TTX cell (n = 360 for both groups). Aii, Cumulative distributions of mEPSC amplitudes from control (black curve) and TTX-treated mouse hippocampal neurons (vermilion curve). Slope and intercept parameters from the linear regression fit in Ai were used to downscale the TTX data (dashed vermilion curve; control, 30 quantiles for 18 cells, n = 540; TTX, 30 quantiles for 20 cells, n = 600; test statistic = 0.099, p = 7.7 × 10⁻³, K–S test). Aiii, For the mouse hippocampal neuron data, the scaling factor that produced the best fit of scaled TTX to control data after discarding downscaled mEPSCs below 7 pA is 2.25 (test statistic = 0.037, p = 0.755, K–S test), but > 40% of the data were discarded after downscaling (n after downscaling = 318; original n = 600). Aiv, Cumulative distributions of scaled TTX (dashed vermilion curve) downscaled by 2.25 and subthreshold mEPSCs removed, and control mEPSCs from mouse hippocampal neurons (black curve). Bi, Rank-order plot of rat cortical neuron data, with linear regression fit (dashed vermilion line). To match the sample sizes, 58 quantiles were computed for each control cell and 47 quantiles were computed for each TTX cell, n = 2726 for both groups. Bii, Cumulative distributions of mEPSC amplitudes for control (black curve) and TTX-treated rat cortical neurons (vermilion curve). Slope and intercept parameters from the linear regression fit in Bi were used to downscale the TTX data (dashed vermilion curve; control, 30 quantiles for 47 cells, n = 1410; TTX, 30 quantiles for 58 cells, n = 1740; test statistic = 0.101, p = 2.9 × 10⁻⁷, K–S test). Biii, For the rat cortical neuron data, the scaling factor that produced the best fit of scaled TTX to control data after discarding downscaled mEPSCs below 5 pA is 1.33 (test statistic = 0.079, p = 2.4 × 10⁻⁴, K–S test); only 25 mEPSCs were discarded after downscaling. Biv, Cumulative distributions of scaled TTX (dashed vermilion curve), downscaled by 1.33 and subthreshold mEPSCs removed, and control data from rat cortical neurons (black curve). Gray lines indicate the line of identity. Blue lines indicate the 25th, 50th, and 75th percentiles. Insets in Ai, Bi, View of the entire data range. Insets in Aii, Aiv, Bii, Biv, Blow up of the initial part of the distribution.

