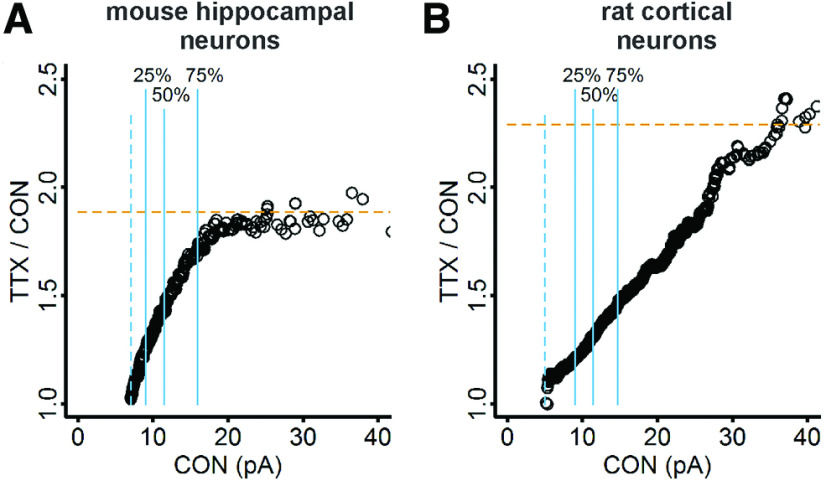
Figure 9.
Ratio plots show divergent scaling in dissociated mouse hippocampal and rat cortical neurons. A, For mouse hippocampal data, the ratio of TTX mEPSC/control mEPSC as a function of control mEPSC increases smoothly until reaching an approximately constant value above the 75th percentile. B, For rat cortical data, the ratio increases continuously over most of the data range. Solid blue lines indicate 25th, 50th, and 75th percentiles. Dashed blue lines show thresholds used in acquisition: 7 pA for mouse hippocampal data and 5 pA for rat cortical data. Dashed horizontal vermilion lines indicate the expected scaling factor determined from the slope of linear regression of the rank-order data.

