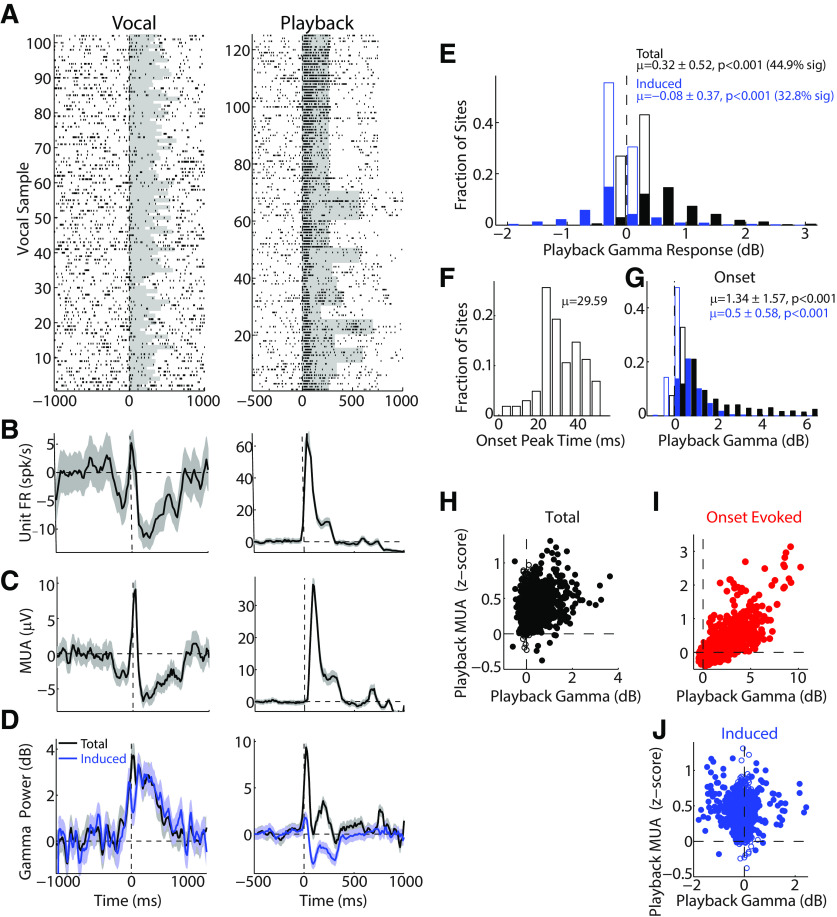
Figure 5.
γ responses during playback of vocal stimuli. A, Raster is shown for a sample single-unit response to vocal production (left) and passive playback of vocal sound stimuli (right). B, C, Spike and MUA PSTHs for the vocal and playback responses shown in A. D, Total (black) and induced (blue) γ responses corresponding to the unit responses above. Unlike vocalization, where γ responses were largely induced, induced γ power during playback was decreased for this recording site. E, Population histogram of total (black) and induced (blue) γ during playback, with positive total γ responses, but weak to slightly reduced induced. Filled bins represent sites with significant playback γ responses (p < 0.05). Percent of significant sites is indicated. F, Timing distribution of playback total γ peak. G, Histogram for total (black) and induced (blue) γ during the onset period (0-50 ms). H, Scatter plot comparing playback total γ and MUA responses, showing a weak correlation (r = 0.21, p < 0.001). Strong correlation was seen for evoked γ responses in the onset period (I, r = 0.77, p < 0.001). However, there was no correlation seen for the weaker induced playback response (J, r = −0.01, p = 0.57).

