Figure 6.
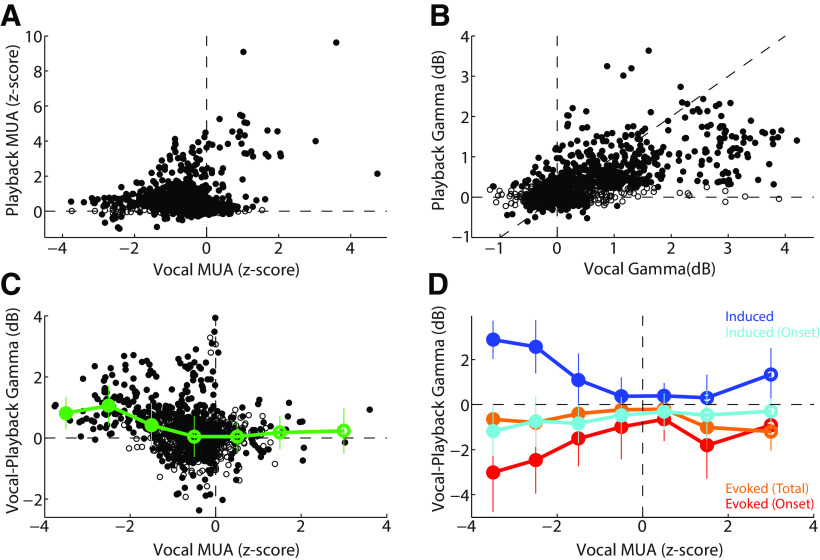
Comparison of vocal production and playback γ responses. A, Scatter plot comparing z-score-normalized MUA activity between vocal production and playback. Units with positive vocal MUAs (excited units) also had positive playback responses. Those with negative vocal MUA responses (suppressed) also had increased playback responses but were more diverse. B, Comparison of vocal and playback total γ-band power, showing a strong correlation (r = 0.63, p < 0.001), and bias toward stronger γ power during vocalization (slope 0.37, 95% CI [0.34, 0.39], or ∼2.5× increase). C, Comparison of vocal-playback total γ power difference as a function of vocal MUA responses. Considerable variability was seen for weakly suppressed units (negative MUA), but there was an overall significant negative correlation between γ changes and vocal MUA (r = −0.29, p < 0.001). Mean and SEM γ changes, binned by vocal MUA response, are shown (green). Filled symbols represent significant bins. D, Comparison of vocal-playback γ changes for induced and evoked components, divided by onset (0-50 ms) and total/sustained timing (0–300 ms). Binned mean and SEM are shown. Induced γ exhibited large vocal increases for suppressed units (negative vocal MUA), whereas evoked γ showed apparent decreases.

