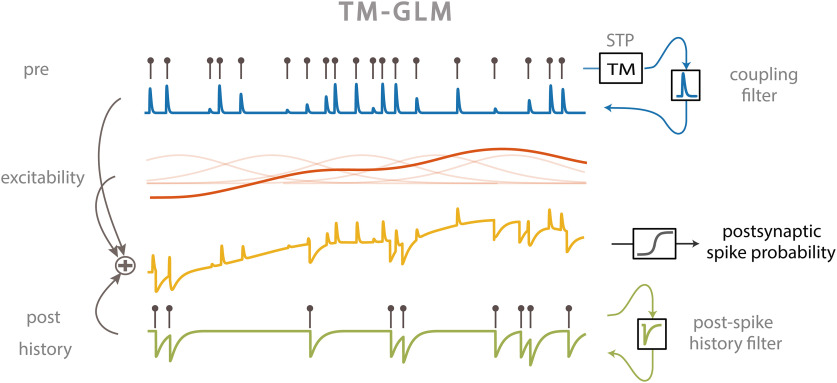
Figure 1.
TM-GLM. Postsynaptic spiking probability before passing the spiking nonlinearity (yellow) changes as a linear combination of presynaptic coupling term with STP dynamics (blue), postsynaptic spiking history (green), the postsynaptic excitability (red). Transparent red curves show the bases of slow changes in postsynaptic probability at presynaptic spike times ().

