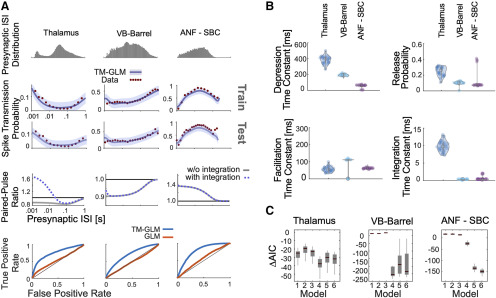
Figure 4.
Including short-term dynamics substantially improves the model of spike transmission. A, Spike transmission patterns are diverse across different connections. For three different connections (between a pair of neurons in thalamus, a projection from VB-Barrel, and an auditory nerve fiber projection onto a SBC) transmission patterns are modeled by a combination of different factors. For each synapse, top panels show the presynaptic ISI distributions (log-spaced). In the second/third row, the observed spike transmission probability (red data points) and model predictions (blue with 95% confidence bands) for training and test set (2-fold cross-validation). We then used the estimated TM parameters for each synapse and simulated responses to paired presynaptic pulses. Blue curves denote the PPRs of the full model, and gray lines denote PPRs by taking synaptic summation out. Bottom row, TM-GLM (blue) are superior in predicting individual postsynaptic transmission events compared with GLM (orange, without STP) for each synapse type. For each individual presynaptic spike, we compare the model transmission probability with the observed binary outcome. ROC curves show the prediction accuracy with positive deviations from the diagonal indicating better performance. B, Estimates for the four STP parameters of the model for each synapse. Dots represent estimates from bootstrap sampled data. C, Model comparison for 6 different models (AIC relative to a model without plasticity). Models: (1) integration only, (2) facilitation only, (3) depression only, (4) three-parameter TM, (5) four-parameter TM without resetting integration, and (6) full model. Boxplots denote the difference in AIC values for bootstrap samples in B.

