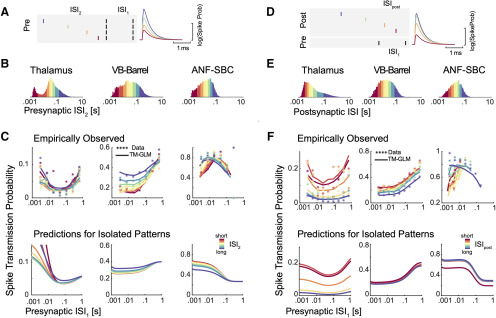
Figure 5.
Presynaptic and postsynaptic spiking history determine transmission probability. A, Schematic of four different patterns of presynaptic spike triplets with a fixed interval between the two most recent presynaptic spikes (spikes denoted by black lines separated by ISI1). B, We then split the presynaptic ISI distribution into eight quantiles, denoted by the different colors. C, We then assess how ISI2 influences the spike transmission previously described for ISI1. Using the natural occurrence of different ISI1 and ISI2 in the data, each data point shows the observed spike transmission probability for each pattern (colors correspond to ISI2 quantiles). Lines denote the average estimated transmission probability for each pattern under the model (based on the natural sequence of observed spikes). To examine the influence of serial correlations, we then simulate model responses to the isolated triplet pattern, assuming the synapse is initially in an average state (bottom panels). D, Synaptic transmission patterns change depending on the history of postsynaptic spiking, as well. E, Note that the postsynaptic ISI distributions need not match the presynaptic distributions. F, Here, each data point in the scatter plots shows the spike transmission probability following different combinations of ISI1 and ISIpost. Here, colors denote quantiles of the postsynaptic ISI distribution. Solid lines show the estimated transmission probability for each pattern under the model (based on the natural sequence of observed spikes). The bottom panels show model responses to isolated patterns using the estimated STP parameters and fixing the excitability from the model fits to their average values.

