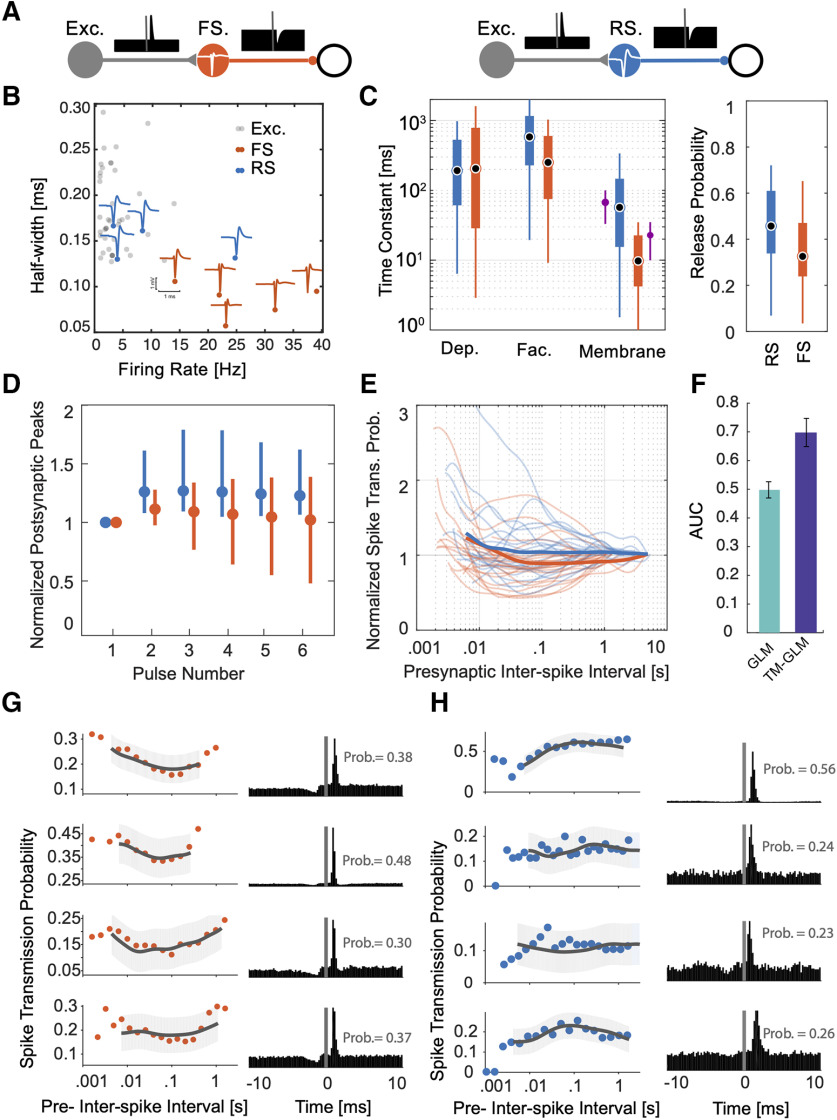
Figure 7.
Distinctive short-term dynamics for spike transmission in connections between excitatory neurons to putative RS and FS inhibitory neurons. A, Here, we examine putative synapses between excitatory neurons and inhibitory neurons (identified by their cross-correlations) and separate the putative inhibitory neurons into two classes: FS, which have narrow spike waveforms and high rates (left), and RS (right), which have wide waveforms and lower rates. Identifying these synapses requires both finding both a putative excitatory input and a putative inhibitory output for the same neuron. B, Half-widths (of the trough) of the spike waveforms and firing rates for the FS (orange) and RS (blue) inhibitory neurons, as well as, their excitatory inputs (gray). Individual blue and orange waveforms (maximum amplitude across the MEA) are shown for all nine putative inhibitory neurons. C, Estimated depression, facilitation, and membrane time constants for excitatory-RS and excitatory-FS connections, along with the release probability (right). The purple error-bar next to the membrane time-constant estimations show the median and standard deviations from in vitro experiments (Perrenoud et al., 2013). D, Simulated PSP amplitudes estimated from TM model of STP using estimated parameters. For each synapse, PSPs are estimated in response to a pulse train with interpulse intervals set to their corresponding average presynaptic ISIs. Dots and error bars denote the median and interquartile range for excitatory-RS (blue) and excitatory-FS (red) connections. These responses include the effect of membrane potential integration. E, Spike transmission probability patterns for individual synapses of excitatory-RS (blue) and excitatory-FS (red) connections normalized by long interval probabilities as a function of the presynaptic ISI. F, AUC of postsynaptic spiking prediction using the static GLM without STP (green) and the TM-GLM with STP (blue). G, H, Spike-transmission probabilities (left) and corresponding cross-correlograms (right) of four putative excitatory inputs to putative FS (G) and RS (H) inhibitory neurons show cell type-specific similarities.

