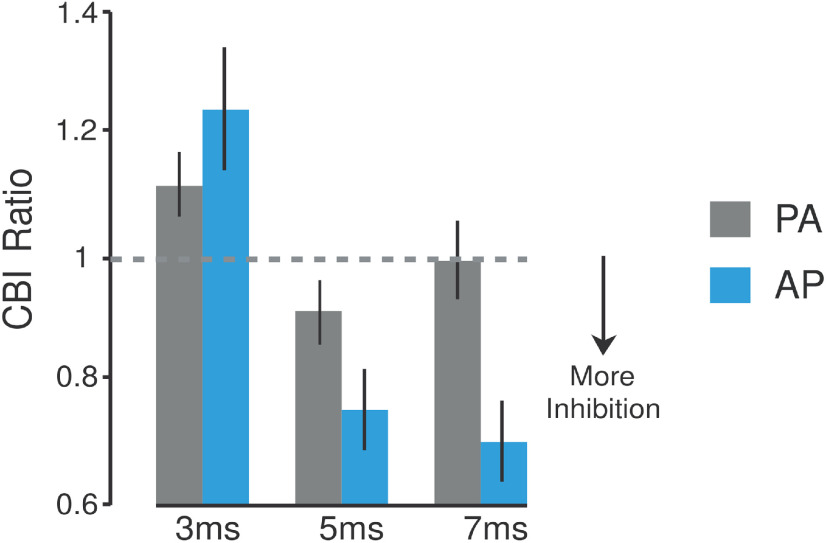
Figure 2.
Matched current intensity control experiment. Schematic representation of the control experiment (n = 6). This study tested whether the CBI differences found in experiment 1 can be explained by the different PA and AP stimulation intensities required to elicit a matched ∼1 mV test MEP response (Table 1). In this experiment, PA-CBI and AP-CBI were retested at ISIs of 3, 5, and 7 ms using the same stimulation intensity for each current direction. The selected intensity was based on the lowest test MEP amplitude value possible to elicit a CBI effect (∼0.5 mV for the AP current; for review, see Pinto and Chen, 2001). Bar graphs and vertical error bars depict the mean ± SEM of the CBI ratio. The x-axis represents different ISIs (3, 5, and 7 ms) applied for both PA-CBI and AP-CBI. The y-axis shows CBI as the ratio of the conditioned versus the unconditioned MEP. Ratio values <1 represent inhibition, whereas ratios >1 represent facilitation. The mean ± SEM PA and AP test MEP amplitude values recorded for this experiment were 2.56 ± 0.42 and 0.60 ± 0.15 mV, respectively.

