Figure 3.
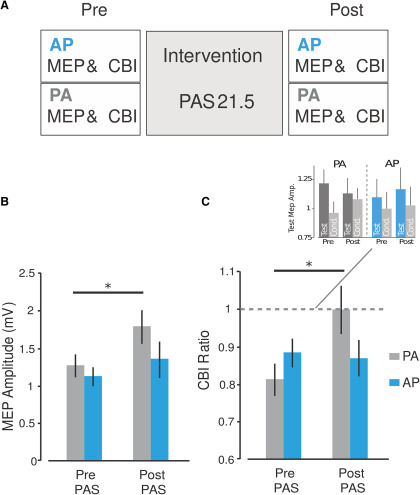
PAS only modulates PA-CBI, and not AP-CBI. A, Schematic representation of experiment 2. For each current direction, M1 excitability and CBI was measured before and after participants received PAS. B, C, PAS effects on M1 excitability (B) and CBI (C). Bar graphs and vertical error bars depict the mean ± SEM, *p ≤ 0.05, where data presented with gray colors represent PA currents applied to M1 and blue colors represent AP currents. The y-axis shows the MEP amplitudes (A) and CBI ratio values (B), while the x-axis displays these values before (pre) and after (post) administration of PAS protocol. B, We found that only MEP amplitudes assessed with PA currents significantly increased with PAS. C, Similarly, we show that PA-CBI, and not AP-CBI, is decreased due to the PAS protocol. Importantly, this change was not due to the PAS-induced M1 excitability changes (i.e., results above) as we adjusted the S1mV when recording CBI for each current direction and time point (inset).

