Figure 10.
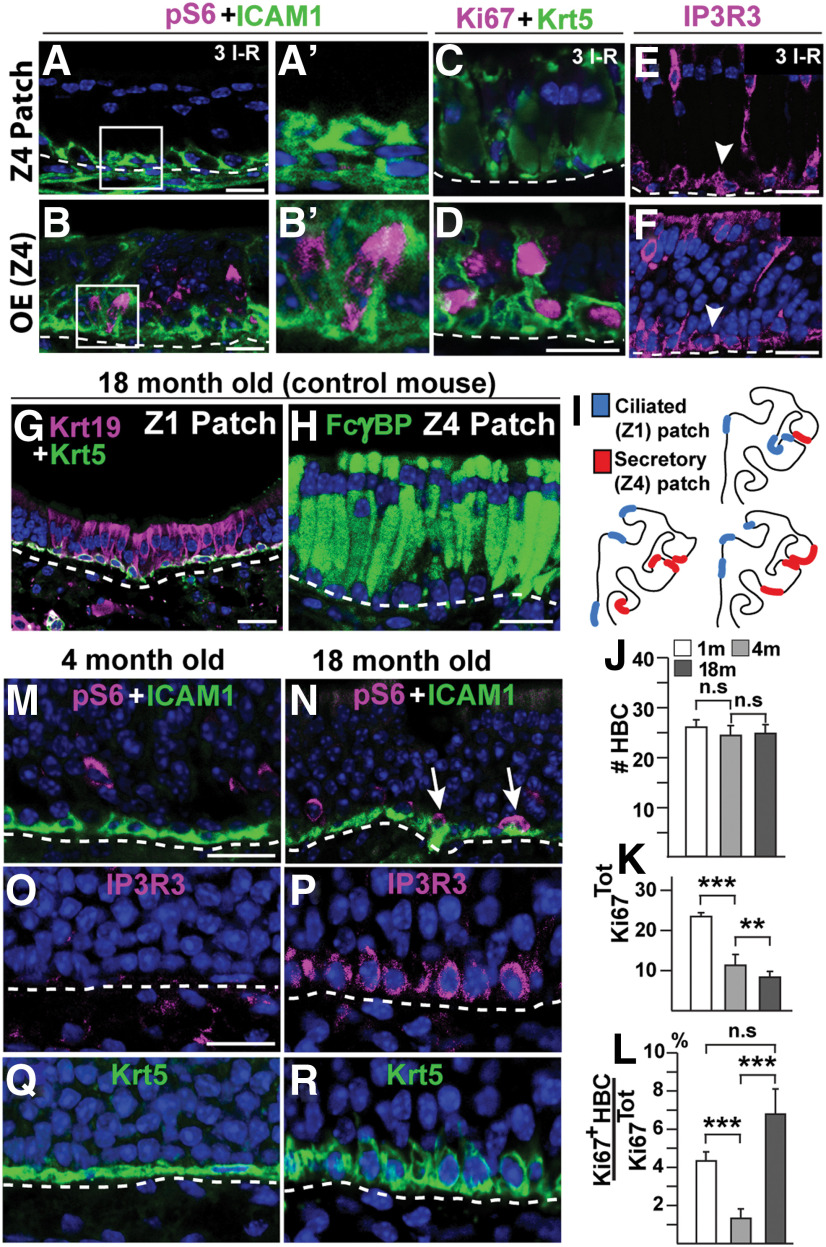
Quiescent HBCs in Z4 patches and HBC activation in old mice. A–F, Immunofluorescence analyses of control mice 6 d after three I–R cycles. A–B′, pS6 (magenta) and ICAM1 (green) analysis of a Z4 patch (A, A′) and adjacent Z4 OE (B, B′). Boxed regions in A and B are magnified and resampled in A′ and B′. C, D, Lack of Ki67 (magenta) in Krt5+ (green) HBCs in a Z4 patch (C) while Ki67+/Krt5+ double-positive HBCs are found in adjacent Z4 OE (D). E, F, IP3R3+ HBCs (arrowheads) in both a Z4 patch and Z4 OE after three I–R cycles. G, Krt19 (magenta) in metaplastic ciliated respiratory cells in a Z1 patch of an 18-month-old control mouse. H, Immunofluorescence for FcγBP (green) in metaplastic secretory cells in a Z4 patch of an 18-month-old control mouse. I, Schematic illustration of the distribution of patches in OE hemisections of three different 18-month-old control mice is shown. J–L, Quantification of cell numbers in OE of 1- (open bars), 4- (gray bars), and 18-month-old (black bars) control mice is shown. J, The total number of Krt5+ HBCs. K, L, The total number of Ki67+ cells (K) and the percentage of Ki67+ HBCs of the total number of Ki67+ cells (Ki67Tot; L). M, N, An increase in the number of ICAM1+ HBCs (green) that are also positive for pS6 (magenta, arrows) in 4-month-old compared with 18-month-old controls. O–R, Induction of IP3R3 (magenta) in HBCs and change from a flat to a rounded cellular morphology of HBCs in control mice between 4 months (O, Q) and 18 months (P, R) of age. Graphs show data from N = 3 mice and n = 8 hemisections per mouse. Error bars represent the mean ± SEM. Two-tailed Student's t test: n.s. nonsignificant, **p < 0.01, ***p < 0.001. Scale bars, 25 µm.

