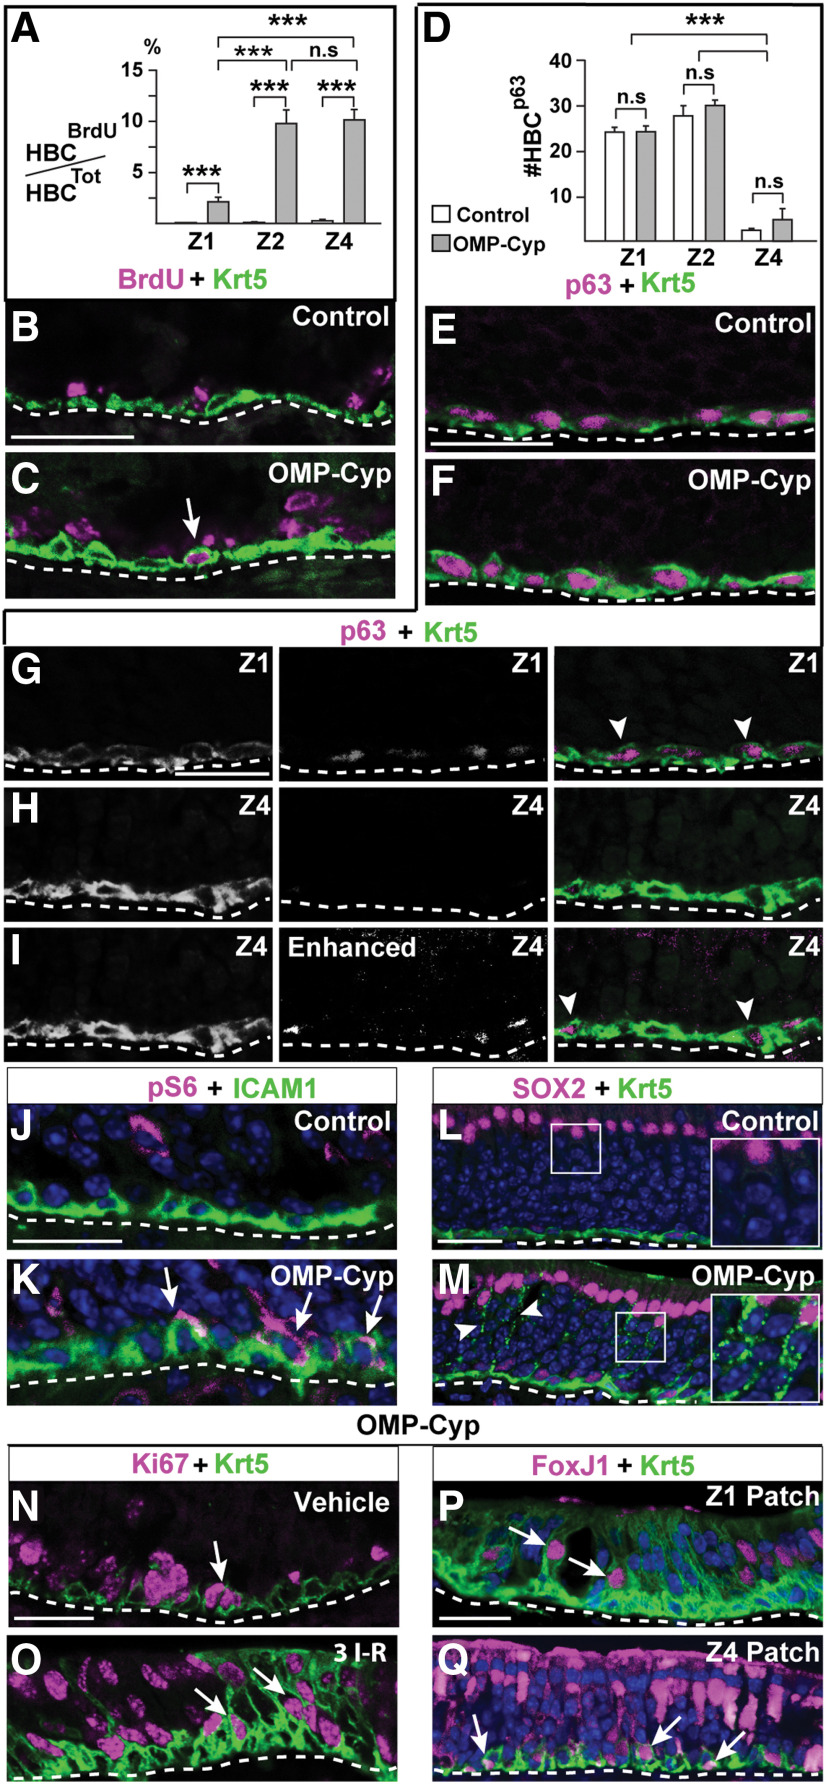
Figure 8.
Increased CYP26B1 in OSNs activates HBCs. A, Quantification of the percentage of BrdU+ HBCs in Z1, Z2, and Z4 of in 5-month-old control (open bars) and OMP-Cyp (gray bars) mice. B, C, Double immunofluorescence for BrdU (magenta) and Krt5 (green). Arrow in C indicates a double-positive HBC. D, Quantification of the number of p63+ HBCs in Z1, Z2, and Z4 of OE. E, F, Krt5 and p63 (magenta) in Z1 of control and OMP-Cyp mice. G, H, Krt5 (green) and p63 (magenta) double-positive cells in Z1 (G, arrowheads) and Krt5+ cells with p63 immunofluorescence below detection threshold in Z4 (H) of OE. I, Enhanced exposure of the p63 signal in H showing that p63 immunofluorescence is present in Z4 HBCs (arrowhead), but with a significantly lower intensity compared with Z1 HBCs. J, K, pS6 (magenta) and ICAM1 (green) analyses of control (J) and OMP-Cyp (K) mice. Arrows in K show the presence of double-positive HBCs. Note that overlap in white is highly localized as ICAM and pS6 are in different cellular compartments. L, M, SOX2 (magenta) and Krt5 (green) analysis showing that SUS cells with Krt5+ puncta (arrowheads) are present in OMP-Cyp (M), but not in control mice (L). Magnified inserts have been resampled to increase resolution. N, O, Ki67 (magenta) and Krt5 (green) in OMP-Cyp mice treated either with vehicle (K) or after three I–R cycles. Arrows indicate double-positive HBCs. P, Q, FoxJ1 (magenta) and Krt5 (green) fluorescence in a Z1 (P) and a Z4 (Q) patch after three I–R cycles in OMP-Cyp mice. Arrows indicate double-positive HBCs. Scale bars, 25 μm. n.s. nonsignificant, ***p < 0.001.

